matplotlib之Artist对象
1. 利用Artist对象绘图
# 什么是Artist对象
# 1.简单的Artist对象是标准的绘图元件,例如Line2D,Rectangle,Text,AxesImage等
# 2.容器类型包含多个Artist对象使他们组织成一个整体例如Axis,Axes,Figure对象
# 利用Artist对象进行绘图的流程分为如下三步
# 1.创建Figure对象
# 2.为Figure对象创建一个或多个Axes对象
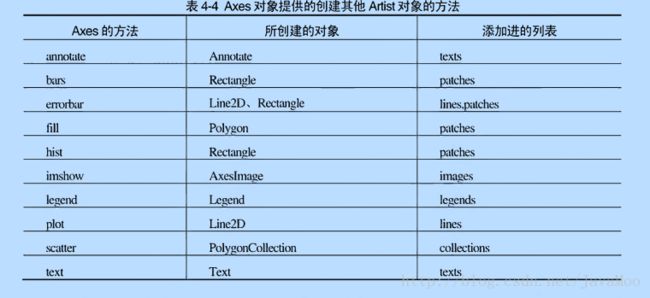
# 3.调用Axes对象的方法来创建各种简单的Artist对象
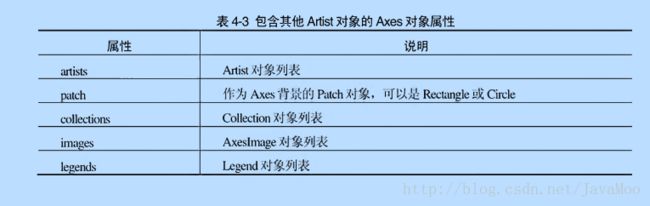
# Artist对象有许多属性控制其显示效果,例如Figure,Axes对象都有patch属性作为背景
# figure()创建Figure对象的时候会进行许多的初始化操作
fig = plt.figure()
# 列表用于描述图片所在的位置以及图片的大小
ax = fig.add_axes([0.15, 0.1, 0.7, 0.3])
ax.set_xlabel('time')
line = ax.plot([1, 2, 3], [1, 2, 1])[0]
# ax的lines属性是一个包含所有曲线的列表
print(line is ax.lines[0])
# 通过get_*获得相应的属性
print(ax.get_xaxis().get_label().get_text())
plt.show()运行结果
True
time
2.设置Artist属性
    fig = plt.figure()
    # 设置背景色
    fig.patch.set_color('g')
    # 必须更新界面才会有效果
    fig.canvas.draw()
    plt.show()
    # artist对象的所有属性都可以通过相应的get_*()和set_*()进行读写
    # 例如设置下面图像的透明度
    line = plt.plot([1, 2, 3, 2, 1], lw=4)[0]
    line.set_alpha(0.5)
    line.set(alpha=0.5, zorder=1)
    # fig.canvas.draw()
    # 输出Artist对象的所有属性名以及与之对应的值
    print(fig.patch)
    plt.show()
除此之外Artist还拥有如下一些属性

3.容器
3.1Figure容器
# 最上层的Artist对象是Figure,它包含组成图表的所有元素
    fig = plt.figure()
    # 创建新的axe1
    ax1 = fig.add_subplot(211)
    ax2 = fig.add_axes([0.1, 0.1, 0.7, 0.3])
    print(ax1 in fig.axes and ax2 in fig.axes)
    for ax in fig.axes:
        # 打开所有子图的栅格显示
        ax.grid(True)
    # 默认的坐标系统以像素点为单位,但是可以通过transform属性修改其使用的坐标系
    plt.show()
例:创建一个figure对象,并在其中添加两条直线
fig = plt.figure()
    # transform让创建的Line2D对象使用Figure对象的坐标系
    # figure属性让Line2D对象知道它在Figure对象中
    line1 = Line2D([0, 1], [0, 1], transform=fig.transFigure, figure=fig, color='r')
    line2 = Line2D([0, 1], [1, 0], transform=fig.transFigure, figure=fig, color='g')
    fig.lines.extend([line1, line2])
    plt.show()
3.2Axes容器
Axes容器是整个matplotlib的核心,它包含了组成图表的许多Artist对象,下面的代码简单实例了对Axes属性的操作
fig = plt.figure()
    ax = fig.add_subplot(111)
    ax.patch.set_facecolor('green')
    x, y = np.random.rand(2, 100)
    line = ax.plot(x, y, '-', color='blue', linewidth=2)[0]
    print(line is ax.lines[0])
    plt.show()
    fig, ax = plt.subplots()
    # 创建柱状图
    n, bins, rects = ax.hist(np.random.randn(1000), 50, facecolor='blue')
    plt.show()
    fig, ax = plt.subplots()
    rect = plt.Rectangle((1, 1), width=5, height=12,color='blue')
    ax.add_patch(rect)
    # print(rect.get_axes() is ax)
    # ax的x轴的范围为0到1,无法显示完整的rect
    print(ax.get_xlim())
    print(ax.dataLim._get_bounds())
    ax.autoscale_view()
    plt.show()
    print(ax.get_xlim())
Axes对象还可以包含其它Artist对象的属性