逻辑回归分类器(Logistic Regression)
目录
- Logistic回归概述
- Logistic回归分类器,Sigmoid 函数
- 最优化理论确定回归系数(weight)
- 梯度上升法
- 数学推导
- 随机梯度上升
- 梯度上升法
- 处理数据的缺失值
- 实例:预测病马死亡率
吃了概率论的亏
2018/10/20补充:
当时写的时候(10/11)没有很好的意识到为什么用最大似然估计(MLE)和有的地方采用的普通最小二乘法(OLS)得出的结论和公式几乎一致。简单地理解,两者都是已知结果,逆推,想要拟合原来的数据。MLE从概率论的角度理解,计算预测结果到实际数据的概率,取其最大值。OLS通过显而易见的“距离”直接比较大小,取最小值,得到最佳拟合。又因为过程中MLE用对数似然函数(加法),OLS用距离的和,因而公式是一样的。
逻辑回归(Logistic Regression)概述
直观来说,用一条直线对一些现有的数据点进行拟合的过程,就叫做回归。Logistic分类的主要思想:根据现有数据对分类边界建立回归公式,并以此分类。建立拟合参数的过程中用到最优化算法,这里用到的是常用的梯度上升法。
一个直观的图片:

一般过程
(1) 收集数据:采用任意方法收集数据。
(2) 准备数据:由于需要进行距离计算,因此要求数据类型为数值型。另外,结构化数据
格式则最佳。
(3) 分析数据:采用任意方法对数据进行分析。
(4) 训练算法:大部分时间将用于训练,训练的目的是为了找到最佳的分类回归系数。
(5) 测试算法:一旦训练步骤完成,分类将会很快。
(6) 使用算法:首先,我们需要输入一些数据,并将其转换成对应的结构化数值;
接着,基于训练好的回归系数就可以对这些数值进行简单的回归计算,判定它们属于
哪个类别;在这之后,我们就可以在输出的类别上做一些其他分析工作。
Logistic回归分类器,Sigmoid 函数
Logistic回归
优点:计算代价不高,易于理解和实现。
缺点:容易欠拟合,分类精度可能不高。
适用数据类型:数值型和标称型数据。
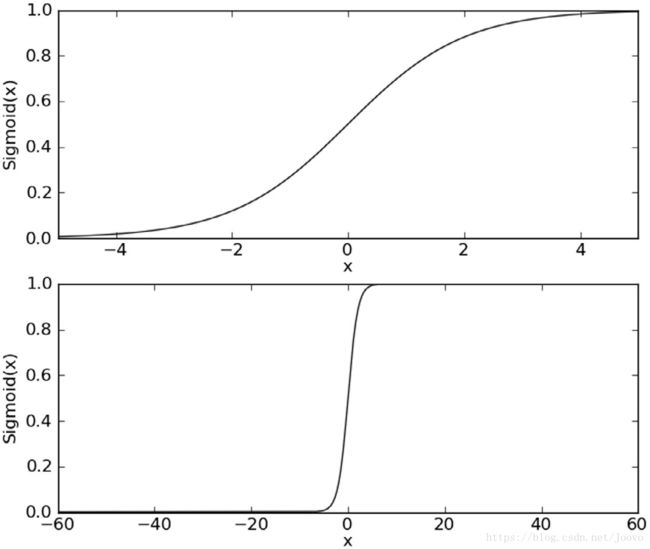
我们想要一个函数,接受所有输入并返回我们的预测值,sigmoid函数符合我们的要求。
g ( z ) = 1 1 + e − z g(z)=\frac{1}{1+e^{-z}} g(z)=1+e−z1

可以在 z>0,即 g(z)>=0.5的时候,认为其是 A 类别,g(z)<0.5 时认为是 B 类别。因此logistic回归也可以视为概率估计。进一步的,g(x)的值就是它等于1的概率,即概率密度函数
对每个实例对象构造一个特征向量x,对x乘上一个回归系数w,再求和,sum作为自变量代入sigmoid函数,就得到一个0-1范围内的数了。接下来确定回归系数(weight)。
性质:
∂ ∂ z g ( z ) = g ( z ) ( 1 − g ( z ) ) \frac{\partial}{\partial z}g(z)=g(z)(1-g(z)) ∂z∂g(z)=g(z)(1−g(z))
最优化理论确定回归系数(weight/θ)
回归系数即weight/θ,我们初始化回归系数为1,再不停用梯度上升法迭代,优化这个系数,直到最大迭代次数或是w达到误差范围内。
sigmoid的输入记为z,那么
z = w 0 x 0 + w 1 x 1 + . . . + w x x n , z=w_0x_0+w_1x_1+...+w_xx_n, z=w0x0+w1x1+...+wxxn,
即 z = w T x , 常 用 θ 来 代 替 w 即 z=w^Tx,常用\theta 来代替w 即z=wTx,常用θ来代替w
所以sigmoid也可以写为 g ( θ T x ) = h θ ( x ) = 1 1 + e − θ T x g(\theta^Tx)=h_\theta(x)=\frac{1}{1+e^{-\theta^Tx}} g(θTx)=hθ(x)=1+e−θTx1
梯度上升法
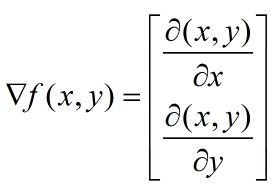
先介绍梯度上升法。要找到某个函数的最大值,最好最快的方法就是沿着函数的梯度方向探寻。如果梯度记为▽(读作“Nabla”),那么函数f(x,y)的梯度由下式表示:

定性来说,梯度上升求出函数最大值,沿x方向移动 ∂ ( x , y ) ∂ x \frac{\partial(x,y)}{\partial x} ∂x∂(x,y),沿y方向移动 ∂ ( x , y ) ∂ x \frac{\partial(x,y)}{\partial x} ∂x∂(x,y),这个点有意义且可微。
再有了方向之后,人为定一个一个“步长” α \alpha α
那么可以写成 w : = w + α ∇ w f ( w ) w:=w+\alpha \nabla_wf(w) w:=w+α∇wf(w)
数学推导 ∇ w f ( w ) \nabla_wf(w) ∇wf(w)
回到我们的讨论,为了求出这个 θ \theta θ,也就是 w w w,为了找出最拟合的线,下面用到最大似然函数,让似然函数最大的 θ \theta θ就是题目要求的 θ \theta θ,求解最大的值的过程中,用的就是梯度上升法。
定义 y 为根据g(z)来判断类别的结果,为1或0。
首先 g(z) 就是它等于1的概率,即概率密度函数,那么根据上述定义:
P ( y = 1 ∣ x ; θ ) = h θ ( x ) P(y=1|x;\theta)=h_{\theta}(x) P(y=1∣x;θ)=hθ(x)
P ( y = 0 ∣ x ; θ ) = 1 − h θ ( x ) P(y=0|x;\theta)=1-h_{\theta}(x) P(y=0∣x;θ)=1−hθ(x)
概率函数为
P ( y ∣ x ; θ ) = ( h θ ( x ) ) y ∗ ( 1 − h θ ( x ) ) ( 1 − y ) , y = 0 , 1 P(y|x;\theta)=(h_{\theta}(x))^y * (1-h_{\theta}(x))^{(1-y)} \space\space\space, y=0,1 P(y∣x;θ)=(hθ(x))y∗(1−hθ(x))(1−y) ,y=0,1
似然函数,联合概率密度函数:
L ( θ ) = ∏ i = 1 m P ( y ( i ) ∣ x ( i ) ; θ ) L(\theta)=\prod_{i=1}^{m} P(y^{(i)}|x^{(i)};\theta) L(θ)=i=1∏mP(y(i)∣x(i);θ)
即
L ( θ ) = ∏ i = 1 m ( h θ ( x ( i ) ) ) y ( i ) ∗ ( 1 − h θ ( x ( i ) ) ) 1 − y ( i ) L(\theta)=\prod_{i=1}^{m} {(h_{\theta}(x^{(i)}))^{y^{(i)}}} *{(1-h_{\theta}(x^{(i)}))^{1-y^{(i)}}} L(θ)=i=1∏m(hθ(x(i)))y(i)∗(1−hθ(x(i)))1−y(i)
取对数似然函数:
l ( θ ) = l o g ( L ( θ ) ) = ∑ i = 1 m y ( i ) l o g ( h θ ( x ( i ) ) ) + ( 1 − y ( i ) ) l o g ( 1 − h θ ( x ( i ) ) ) l(\theta)=log(L(\theta))=\sum_{i=1}^{m} {y^{(i)}}log{(h_{\theta}(x^{(i)}))} + ({1-y^{(i)}})log{(1-h_{\theta}(x^{(i)}))} l(θ)=log(L(θ))=i=1∑my(i)log(hθ(x(i)))+(1−y(i))log(1−hθ(x(i)))
其梯度算子:
代入 h θ ( x ) h_\theta(x) hθ(x),求导:
∂ ∂ θ l ( θ ) = ( y 1 g ( θ T x ) − ( 1 − y ) 1 1 − g ( θ T x ) ) ∂ ∂ θ ( g ( θ T x ) ) \frac{\partial }{\partial \theta}l(\theta)=(y\frac{1}{g(\theta^Tx)}-(1-y)\frac{1}{1-g(\theta^Tx)})\frac{\partial}{\partial \theta}(g(\theta^Tx)) ∂θ∂l(θ)=(yg(θTx)1−(1−y)1−g(θTx)1)∂θ∂(g(θTx))
= ( y − h θ ( x ) ) x =(y-h_\theta(x))x =(y−hθ(x))x
所以: θ : = θ + α ∑ j = 1 m ( y − h θ ( x ) ) x \theta:=\theta+\alpha \sum_{j=1}^{m} (y-h_\theta(x))x θ:=θ+αj=1∑m(y−hθ(x))x
θ 即 w \theta 即 w θ即w
画出决策边界
z=0时,g(z)=0.5 是两个类别的分界。因此令 x 0 + x 1 w 1 + x 2 w 2 = 0 x_0+x_1w_1+x_2w_2=0 x0+x1w1+x2w2=0 即为拟合直线的方程。
from numpy import *
import matplotlib.pyplot as plt


def sigmoid(inX):
    return 1.0 / (1 + exp(-inX))


def load_dataset():
    data_mat = []
    label_mat = []
    with open('testSet.txt', 'r')as file:
        for line in file.readlines():
            cur_line = line.strip().split()
            data_mat.append([1.0, float(cur_line[0]), float(cur_line[1])])
            label_mat.append(float(cur_line[-1]))
    return data_mat, label_mat


# gradient ascent 梯度 上升
def grad_ascent(data_mat, label_mat):
    data_mat = mat(data_mat)  # convert to np matrix
    label_mat = mat(label_mat).transpose()
    m, n = shape(data_mat)
    weights = ones((n, 1))  # init the weight
    alpha = 0.001
    max_cycles = 500
    for k in range(max_cycles):
        h = sigmoid(data_mat * weights)  # m*1
        error = (label_mat - h)
        weights += alpha * data_mat.transpose() * error
    return weights


def plot_best_fit(data_mat, label_mat, weights):
    # 画所有点,用绿色红色标出
    xcord1 = []
    ycord1 = []
    xcord2 = []
    ycord2 = []
    n = shape(data_mat)[0]
    data_mat=array(data_mat)
    for i in range(n):
        if (int)(label_mat[i]) == 1:
            xcord1.append(data_mat[i, 1])
            ycord1.append(data_mat[i, 2])
        else:
            xcord2.append(data_mat[i, 1])
            ycord2.append(data_mat[i, 2])
    fig = plt.figure()
    ax = fig.add_subplot(111)  # 1*1 with 1 grid
    ax.scatter(xcord1, ycord1, s=30, c='red', marker='s')
    ax.scatter(xcord2, ycord2, s=30, c='green')
    x = arange(-3.0, 3.0, 0.1)  # start , end ,step
    y = (-weights[0] - weights[1] * x) / weights[2]  # 分界线 w0+w1x1+w2x2=0
    ax.plot(x, y)
    plt.xlabel('X1')
    plt.ylabel('X2')
    plt.show()


if __name__ == '__main__':
    data_mat, label_mat = load_dataset()
    weights = grad_ascent(data_mat, label_mat)
    plot_best_fit(data_mat, label_mat, weights)
随机梯度上升 Stochastic gradient ascent
上面的梯度上升算法遍历了整个数据集,称为批处理(反之称为在线学习算法),而且迭代次数高达500次。随机梯度上升是一个改进的方法。要解决迭代次数过多和每次遍历整个数据集的问题。
用随机选择数据的方法解决每次遍历整个数据集
用每次调整alpha的办法来加快梯度的收敛速度,这里就不深究了。
# Stochastic gradient descent
def stoc_grad_ascent(data_mat, label_mat, max_cycle=150):
    data_mat=array(data_mat)
    m, n = shape(data_mat)
    weights = ones(n)
    for j in range(max_cycle):
        data_index = list(range(m))
        for i in range(m):
            alpha = 4.0 / (1 + i + j) + 0.0001
            rand_index = int(random.uniform(0, len(data_index)))
            h = (sigmoid(sum(data_mat[rand_index] * weights)))
            error = label_mat[rand_index] - h
            weights += alpha * error * data_mat[rand_index]
            del (data_index[rand_index])
    return weights
实例:预测病马死亡率
处理数据的缺失值
- 使用可用特征的均值来填补缺失值;
- 使用特殊值来填补缺失值;
- 忽略有缺失值的样本;
- 使用相似样本的均值添补缺失值;
- 使用另外的机器学习算法预测缺失值。
逻辑回归可用特殊值来填补。
包含20个特征的实例。
代码仍然是处理数据和测试算法。
from numpy import *
import matplotlib.pyplot as plt


def sigmoid(inX):
    return 1.0 / (1 + exp(-inX))


def load_dataset():
    data_mat = []
    label_mat = []
    with open('testSet.txt', 'r')as file:
        for line in file.readlines():
            cur_line = line.strip().split()
            data_mat.append([1.0, float(cur_line[0]), float(cur_line[1])])
            label_mat.append(float(cur_line[-1]))
    return data_mat, label_mat


# gradient ascent 梯度 上升
def grad_ascent(data_mat, label_mat):
    data_mat = mat(data_mat)  # convert to np matrix
    label_mat = mat(label_mat).transpose()
    m, n = shape(data_mat)
    weights = ones((n, 1))  # init the weight
    alpha = 0.001
    max_cycles = 500
    for k in range(max_cycles):
        h = sigmoid(data_mat * weights)  # m*1
        error = (label_mat - h)
        weights += alpha * data_mat.transpose() * error
    return weights


def plot_best_fit(data_mat, label_mat, weights):
    # 画所有点,用绿色红色标出
    xcord1 = []
    ycord1 = []
    xcord2 = []
    ycord2 = []
    n = shape(data_mat)[0]
    data_mat = array(data_mat)
    for i in range(n):
        if (int)(label_mat[i]) == 1:
            xcord1.append(data_mat[i, 1])
            ycord1.append(data_mat[i, 2])
        else:
            xcord2.append(data_mat[i, 1])
            ycord2.append(data_mat[i, 2])
    fig = plt.figure()
    ax = fig.add_subplot(111)  # 1*1 with 1 grid
    ax.scatter(xcord1, ycord1, s=30, c='red', marker='s')
    ax.scatter(xcord2, ycord2, s=30, c='green')
    x = arange(-3.0, 3.0, 0.1)  # start , end ,step
    y = (-weights[0] - weights[1] * x) / weights[2]  # 分界线 w0+w1x1+w2x2=0
    ax.plot(x, y)
    plt.xlabel('X1')
    plt.ylabel('X2')
    plt.show()


# Stochastic gradient descent
def stoc_grad_ascent(data_mat, label_mat, max_cycle=150):
    data_mat=array(data_mat)
    m, n = shape(data_mat)
    weights = ones(n)
    for j in range(max_cycle):
        data_index = list(range(m))
        for i in range(m):
            alpha = 4.0 / (1 + i + j) + 0.0001
            rand_index = int(random.uniform(0, len(data_index)))
            h = (sigmoid(sum(data_mat[rand_index] * weights)))
            error = label_mat[rand_index] - h
            weights += alpha * error * data_mat[rand_index]
            del (data_index[rand_index])
    return weights

def classify_vec(vec,weights):
    prob=sigmoid(sum(vec*weights))
    return 1.0 if prob>=0.5 else 0.

def colic_test():
    fr_train = open('horseColicTraining.txt');
    fr_test = open('horseColicTest.txt')
    train_set = []
    train_labels = []
    for line in fr_train.readlines():
        cur_line = line.strip().split('\t')
        line_arr = []
        for i in range(21):
            line_arr.append(float(cur_line[i]))
        train_set.append(line_arr)
        train_labels.append(float(cur_line[21]))
    train_weights = stoc_grad_ascent(array(train_set), train_labels, 1000)
    error_count = 0
    num_test_vec = 0.0
    for line in fr_test.readlines():
        num_test_vec += 1.0
        cur_line = line.strip().split('\t')
        line_arr = []
        for i in range(21):
            line_arr.append(float(cur_line[i]))
        if int(classify_vec(array(line_arr), train_weights)) != int(cur_line[21]):
            error_count += 1
    errorRate = (float(error_count) / num_test_vec)
    print("the error rate of this test is: %f" % errorRate)
    return errorRate

def multi_test():
    num_tests = 10;
    error_sum = 0.0
    for k in range(num_tests):
        error_sum += colic_test()
    print("after %d iterations the average error rate is: %f".format(num_tests, error_sum / float(num_tests)))


if __name__ == '__main__':
    '''
    data_mat, label_mat = load_dataset()
    weights = stoc_grad_ascent(data_mat, label_mat)
    plot_best_fit(data_mat, label_mat, weights)
    '''
    multi_test()
参考:极大似然估计详解