用python实现图形显示“线性回归+梯度下降”算法
刚开始学习CS229,
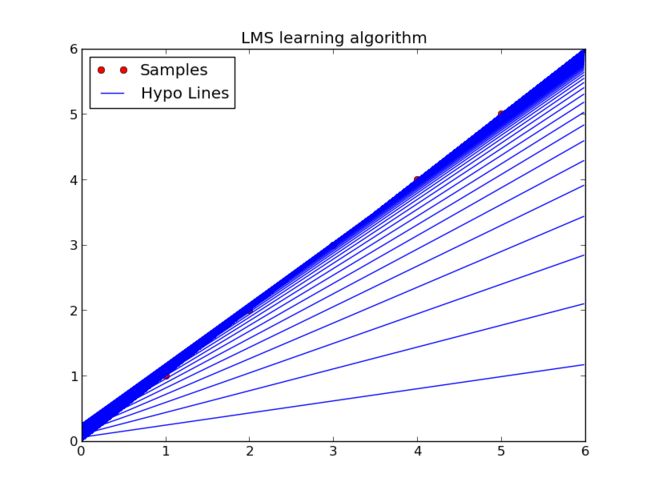
Part I中关于线性回归讲解非常细致,相当基础的内容,感觉还挺容易实现的,就尝试用python实现,经过一番尝试,最后能逼近样本并且画出图,效果如下:
图是通过python的一个图形库matplotlib画的,这个库旨在用python实现matlab的画图功能(或者还有计算功能,不过计算功能主要是numpy这个库来做的)
算法方面,实现的是最基本的 Linear regression(预估H线性函数,用梯度下降计算最小的J),算法本身能够支持任意样本点输入、任意维度的X,为了画出二维的效果图,只设置成为1维输入。
先说算法(其实也没什么好说的,自己备忘)
使用线性的预估函数:
![]()
考虑所有样本点,令:
使用梯度下降算法迭代其中的theta
这是一个单一样本情况,多样本时只要对第二项求和即可。其中的alpha是learning rate,在用的过程中发现这个值还不能取的太大,要不然一下函数就跑偏了。。。
当迭代后的函数J值比前一次的大,也就是说,之前取到过最优解了,停止迭代。将theta带入h函数即可得到预估的线性函数。
说说画图, 每次迭代theta的时候画一条H,因为在循环里,没有标注不同颜色,标每条线的名称还不会。。。。
代码(还没改动,粗率写的):
#!/usr/bin python

import math
import numpy as np
import copy
from pylab import *

def hy(x_sample, theta):
	# hypothsis = theta0 + theta1 * x1 + theta2 * x2 .....
	temp = [x * y for x,y in zip(theta, x_sample)]
	result = sum(temp)
	return result

def jtheta(x_set, y_set, theta):
	# jtheta function ...
	result = sum([pow(hy(x, theta) - y, 2) for (x,y) in zip(x_set, y_set)])
	result = result/2
	return result


x = []
y = []

nums = input("Input example numbers:")
dim = input("Input example dimensions:")

for i in range(0, nums):
	x_temp = []
	x_temp.append(1)
	for j in range(0, dim):
		x_value = input("%d x:"%(j + 1))
		x_temp.append(x_value)
	y_temp = input("%d y:"%(i + 1))
	x.append(x_temp)
	y.append(y_temp)

print "x vectors:"
print x
print "y vectors:"
print y

# PLOT EXAMPLE POINTS
if dim == 1:
	x_point = [item[1] for item in x]
	y_point = y
	plot(x_point, y_point, 'ro')
	axis([0, 6, 0, 6])

# INITIALIZE THETA BY ALL ZERO
theta = [0 for i in range(dim + 1)]

# SET ALPHA (LEARNING RATE)!!!!!!!!!!!!!!!1
alpha = 0.1

# LEARNING BEGIN
last_j = 0.0
current_j = 0.0
first_flag = True
k = 0
allTheta = []
while True:
	k = k + 1
	theta_last = theta
	print "-----iterate theta for : %d.-----" %(k)
	for j in range(0, dim + 1):
		print "compute %d theta." %(j)
		sum_temp = sum([(y_sample - hy(x_sample, theta_last)) * x_sample[j] for (x_sample, y_sample) in zip(x, y)])
		theta[j] = theta[j] + alpha * sum_temp
		print theta

	current_j = jtheta(x, y, theta)
	print "current j:"
	print current_j
	if (first_flag == True):
		first_flag = False
	else:
		if (current_j >= last_j):
			theta = theta_last
			print "found the minimum j(last one), break."
			print ""
			print "the hypothsis theta is :"
			print theta
			break

	last_j = current_j
	if dim == 1:
		t1 = arange(0.0, 6.0, 0.02)
		plot(t1, theta[0] + theta[1] * t1, 'b')

if dim==1:
	legend( ('Samples', 'Hypo Lines'), loc = 'upper left')
	title('LMS learning algorithm')
	show()

exit()
以后可以
1. 直接用最小二乘搞定
2. 试试人工根据一维加入二维,也就是重写H函数(这个需要经验)
3. 试试局部加权线性回归
4. 多维度线性回归
一个线性回归,就有这么多分支可以尝试。
写下来之后,感觉自己的python又一次抛到了脑后。。。。。
coding和算法都要加强!
其中公式直接用了 http://www.cnblogs.com/jerrylead/archive/2011/03/05/1971867.html 的,感觉算法方面这页讲的算清楚了。
另外,发现一个有趣的现象,如果样本数量增加,学习率必须变小,否则很难迭代到正常数值。不知道为什么
5个样本 需要0.1左右的学习率
10个样本 需要 0.001左右的学习率
15个样本需要 0.0005左右
是为什么呢?
补充:下一步还可以画出 J 函数,目前J与两个theta应该是个三维图像


