1D卷积网络HAR(人体活动识别)实践
HAR(人体活动识别)是根据加速度计序列数据,将活动分类为已知的预定义的活动类别,其数据是由专业设备或智能手机记录的。
解决这个问题的传统方法需要手工制作特征,这些特征来自于基于固定大小的窗口和训练机器学习模型的时间序列数据,例如集成决策树。而难点在于,这种特征工程需要在该领域拥有深厚的专业知识。
最近,一些深度学习方法,如循环神经网络和一维卷积神经网络,以及各种CNN,在很少或没有数据特征工程的情况下,已经能够达到目前的最好结果。
本文,我们探索1D卷积网络处理HAR问题。
数据集
HAR,简而言之,就是通过一段传感器信号预测一个人正在做什么。我们使用2012年Genova大学发布的一个HAR数据集:
Human Activity Recognition Using Smartphones Data Set, UCI Machine Learning Repository
这些数据是由30名年龄在19岁至48岁之间的受试者收集的,他们穿着齐腰的智能手机记录运动数据,进行了六项标准活动:
- Walking
- Walking Upstairs
- Walking Downstairs
- Sitting
- Standing
- Laying
数据集可以通过此链接下载:
UCI HAR Dataset.zip
下载后将所有文件解压缩,在当前工作目录中新建名为“HARDataset”的目录,并把解压缩后的文件放入其中。
记录的移动数据是来自智能手机的x、y和z加速计数据(线性加速度)和陀螺仪数据(角速度),特别是三星的Galaxy S II。记录频率为50赫兹(即每秒50个数据点)。每个受试者依次执行两次活动,分别将设备置于左手边和右手边。
原始数据经过了一些预处理:
- 使用噪音过滤器预处理加速计和陀螺仪信号。
- 将数据分割为2.56秒(128个数据点)的固定窗口,窗口间有50%的重叠。
- 将加速度计数据分解为重力和身体活动两部分。
X_train.txt和X_test.txt中的特征是经过特征工程得到的,由每个窗口中提取的常用的一些时间和频率特征构成,共561个特征。
以下为详细的处理过程:
-
原始数据通过中值滤波和第三阶低通Butterworth滤波器进行过滤,频率为20赫兹,以消除噪音。类似地,使用另一个低通Butterworth滤波器,频率为0.3赫兹,将加速信号分离为身体和重力加速度信号(tBodyAcc-XYZ和tGravityAcc-XYZ)。
-
在此基础上,通过时间推导出了物体的线性加速度和角速度,从而获得了急动度信号(加加速度)(tBodyAccJerk-XYZ和tBodyGyroJerk-XYZ)。此外,这些三维信号的大小是用欧几里得范数(tBodyAccMag, tGravityAccMag, tBodyAccJerkMag, tBodyGyroMag, tBodyGyroJerkMag)计算出来的。
-
最后,通过快速傅里叶变换(FFT)得到fBodyAcc-XYZ, fBodyAccJerk-XYZ, fBodyGyro-XYZ, fBodyAccJerkMag, fBodyGyroMag, fBodyGyroJerkMag。(注意“f”表示频率域信号)。
-
将以下信号用于估算每个模式的特征向量的各种变量:
(“XYZ”用于表示X、Y和Z方向上的3轴信号)
tBodyAcc-XYZ
tGravityAcc-XYZ
tBodyAccJerk-XYZ
tBodyGyro-XYZ
tBodyGyroJerk-XYZ
tBodyAccMag
tGravityAccMag
tBodyAccJerkMag
tBodyGyroMag
tBodyGyroJerkMag
fBodyAcc-XYZ
fBodyAccJerk-XYZ
fBodyGyro-XYZ
fBodyAccMag
fBodyAccJerkMag
fBodyGyroMag
fBodyGyroJerkMag
从这些信号中估算出的一系列变量是:
mean(): 均值
std(): 标准差
mad(): 绝对中位差
max(): 最大值
min(): 最小值
sma(): 信号幅度区域
energy(): 能量(平方和除以值的个数)
iqr(): 四分位差
entropy(): 信号熵
arCoeff(): 带伯格序列的自回归系数等于4
correlation(): 两个信号之间的相关系数
maxInds(): 最大震级的频率分量指数
meanFreq(): 频率成分的加权平均值得到的平均频率
skewness(): 频域信号偏态
kurtosis(): 频率域信号峰度
bandsEnergy(): 每个窗口的FFT的64个箱子中的频率间隔的能量
angle(): 向量间夹角 -
通过在信号窗口样本中对信号进行平均化得到的额外的向量。这些都用于angle() 变量:
gravityMean
tBodyAccMean
tBodyAccJerkMean
tBodyGyroMean
tBodyGyroJerkMean -
完整的特征列表位于“features.txt”中。
根据实验对象的数据,如21个受试者的数据用于训练集,9个用于测试集,将数据集分成训练集(70%)和测试集(30%)。
接下来,我们仅使用train和test下Inertial Signals路径下的数据,也就是未经特征工程处理的数据。
1D卷积网络
卷积神经网络模型主要用于图像分类问题,在该过程中,模型学习了二维输入的内部表示,称为特征学习。同样的过程可以被利用在一维的序列数据上,例如HAR的加速度和陀螺仪数据。该模型学习从序列中提取特征,以及将内部特征映射到不同的活动类型。
使用CNN进行序列分类的好处是,他们可以直接从原始时间序列数据中学习,也不需要专业知识来手工设计输入特性。该模型可以学习时间序列数据的内部表示,得到一个性能可观的模型(跟由特征工程数据集训练出的模型相比)。
加载数据
原始数据中有3个主要的类型: total acceleration, body acceleration, and body gyroscope. 每一类有3个维度,也就是说一个时间步有9个变量。此外,每组数据都被划分为2.65秒(128个时间步)的带重叠的窗口。这样每一行就有128*9(1152)个特征,相比于特征工程后的561个特征,显得有些冗余。
这些数据在train和test下的/Inertial Signals/目录中。每个信号的每个轴都存储在一个单独的文件中,这意味着每一个train和test数据集都有9个输入文件要加载,一个输出文件要加载。我们可以根据一致的目录结构和文件名,将这些文件的分组加载。
输入数据是用空格分隔的CSV格式的。这些文件中的每一个都可以作为一个NumPy数组加载。下面的loadfile()函数装载一个数据集,给定文件路径到文件,并将载入的数据作为NumPy数组返回。
# load a single file as a numpy array
def load_file(filepath):
	dataframe = read_csv(filepath, header=None, delim_whitespace=True)
	return dataframe.values
然后,我们可以将给定(train或test)的所有数据加载到单个三维NumPy数组中,维度为[samples, time steps, features]。每个样本有128个时间步,每个时间步有9个特征,其中的样本数量是给定原始信号数据文件中的行数。下面的loadgroup()函数实现了这个功能。Numpy中函数dstack()允许我们将每个加载的3D数组堆叠到一个单独的3D数组中。
# load a list of files into a 3D array of [samples, timesteps, features]
def load_group(filenames, prefix=''):
	loaded = list()
	for name in filenames:
		data = load_file(prefix + name)
		loaded.append(data)
	# stack group so that features are the 3rd dimension
	loaded = dstack(loaded)
	return loaded
我们可以使用这个函数来加载给定组的所有输入信号数据,比如train或test。下面的loaddatasetgroup()函数使用train和test目录之间一致的命名约定来加载单个组所有输入信号数据和输出数据。
# load a dataset group, such as train or test
def load_dataset_group(group, prefix=''):
	filepath = prefix + group + '/Inertial Signals/'
	# load all 9 files as a single array
	filenames = list()
	# total acceleration
	filenames += ['total_acc_x_'+group+'.txt', 'total_acc_y_'+group+'.txt', 'total_acc_z_'+group+'.txt']
	# body acceleration
	filenames += ['body_acc_x_'+group+'.txt', 'body_acc_y_'+group+'.txt', 'body_acc_z_'+group+'.txt']
	# body gyroscope
	filenames += ['body_gyro_x_'+group+'.txt', 'body_gyro_y_'+group+'.txt', 'body_gyro_z_'+group+'.txt']
	# load input data
	X = load_group(filenames, filepath)
	# load class output
	y = load_file(prefix + group + '/y_'+group+'.txt')
	return X, y
然后,我们加载train和test中的所有数据。
输出数据是用整数定义的类型。我们必须对这些类型整数进行独热编码,以便数据适合于拟合神经网络的多分类模型。我们可以通过调用Keras函数to_categorical()来做到这一点。
下面的loaddataset()函数实现了这个功能,并返回train和test的X和y,用于训练和评估模型。
# load the dataset, returns train and test X and y elements
def load_dataset(prefix=''):
	# load all train
	trainX, trainy = load_dataset_group('train', prefix + 'HARDataset/')
	print(trainX.shape, trainy.shape)
	# load all test
	testX, testy = load_dataset_group('test', prefix + 'HARDataset/')
	print(testX.shape, testy.shape)
	# zero-offset class values
	trainy = trainy - 1
	testy = testy - 1
	# one hot encode y
	trainy = to_categorical(trainy)
	testy = to_categorical(testy)
	print(trainX.shape, trainy.shape, testX.shape, testy.shape)
	return trainX, trainy, testX, testy
训练和验证模型
我们定义一个函数,命名为evaluate_model(),输入训练集和测试集,并在训练集上拟合模型,在测试集上评估模型,然后返回模型性能的评估。
首先,我们用Keras深度学习库定义一个CNN模型,模型的输入为3个维度[samples, time steps, features]。每一个样本都是一个时间序列窗口,每个窗口都有128个时间步,每个时间步有9个特征。模型的输出是一个6维的向量,表示当前窗口属于每个活动类型的概率。输入输出的维度需要提前指定,这个我们可以从训练集得到。
n_timesteps, n_features, n_outputs = trainX.shape[1], trainX.shape[2], trainy.shape[1]
为了简便,我们可以将模型定义为Sequential Keras model。它包含2个1维卷积层,然后是一个dropout层,再加一个池化层。一般为了使模型更好地从输入数据中学习特征,会定义两个卷积层作为一组。CNN学习速度很快,dropout层可以减慢学习过程并很可能使最终的模型效果更好。而池化层将学习到特征减小到1/4,使其保留最重要的元素。
CNN和池化层之后,学到的特征被展开成一个长的向量,再经过一个全连接层,然后到达输出层,进行预测。这个全连接层为学习到的特征和输出之间提供了一个很好的缓冲,在预测之前将学到的特征进行翻译。
对于这个模型,我们使用标准的64个feature maps,大小为3的kernel。feature maps可以看作输入序列被处理的次数,kernel size可以看作被处理的输入序列的时间步数。我们使用高效的Adam算法来优化网络,用分类的cross entropy作为损失函数。我们预设训练的epoch为10,batch size为32,训练完后直接在测试集上进行评估,并将测试集的准确率返回。
# fit and evaluate a model
def evaluate_model(trainX, trainy, testX, testy):
	verbose, epochs, batch_size = 0, 10, 32
	n_timesteps, n_features, n_outputs = trainX.shape[1], trainX.shape[2], trainy.shape[1]
	model = Sequential()
	model.add(Conv1D(filters=64, kernel_size=3, activation='relu', input_shape=(n_timesteps,n_features)))
	model.add(Conv1D(filters=64, kernel_size=3, activation='relu'))
	model.add(Dropout(0.5))
	model.add(MaxPooling1D(pool_size=2))
	model.add(Flatten())
	model.add(Dense(100, activation='relu'))
	model.add(Dense(n_outputs, activation='softmax'))
	model.compile(loss='categorical_crossentropy', optimizer='adam', metrics=['accuracy'])
	# fit network
	model.fit(trainX, trainy, epochs=epochs, batch_size=batch_size, verbose=verbose)
	# evaluate model
	_, accuracy = model.evaluate(testX, testy, batch_size=batch_size, verbose=0)
	return accuracy
输出结果
由于神经网络具有随机性,即使使用相同的数据和相同的配置,也可能得到不同的结果。这是该网络的一个特点,它为模型提供了自适应能力,但是需要一个稍复杂的评估方式。我们将对模型进行多次评估,然后对每一次运行进行总结。比如,我们可以调用10次evaluate_model()。这样就可以对多个模型的评估分数进行总结。
# repeat experiment
scores = list()
for r in range(repeats):
	score = evaluate_model(trainX, trainy, testX, testy)
	score = score * 100.0
	print('>#%d: %.3f' % (r+1, score))
	scores.append(score)
我们可以通过其性能均值和标准差进行评估。均值用于表示模型在数据集上的平均准确率,标准差表示准确率均值的平均波动。
# summarize scores
def summarize_results(scores):
	print(scores)
	m, s = mean(scores), std(scores)
	print('Accuracy: %.3f%% (+/-%.3f)' % (m, s))
将这些流程放在一个主函数里run_experiment()。
# run an experiment
def run_experiment(repeats=10):
	# load data
	trainX, trainy, testX, testy = load_dataset()
	# repeat experiment
	scores = list()
	for r in range(repeats):
		score = evaluate_model(trainX, trainy, testX, testy)
		score = score * 100.0
		print('>#%d: %.3f' % (r+1, score))
		scores.append(score)
	# summarize results
	summarize_results(scores)
运行代码:
run_experiment()
(7352, 128, 9) (7352, 1)
(2947, 128, 9) (2947, 1)
(7352, 128, 9) (7352, 6) (2947, 128, 9) (2947, 6)

>#1: 88.904
>#2: 90.499
>#3: 89.108
>#4: 91.313
>#5: 91.177
>#6: 91.449
>#7: 90.838
>#8: 92.128
>#9: 89.311
>#10: 91.008

[88.90397013912454, 90.49881235154395, 89.10756701730574, 91.31319986426874, 91.17746861214795, 91.44893111638956, 90.83814048184594, 92.12758737699356, 89.31116389548693, 91.00780454699695]
Accuracy: 90.573% (+/-1.043)
首先,打印出了训练集和测试集的形状,然后是训练集和测试集的输入输出的元素,以此确认了样本数,时间步,特征数,类别数。然后是重复10次训练的debug信息。最后是10次训练的分数,以及他们的均值和标准差。可以看到,模型在原始数据上训练得到了90.57%的准确率,标准差为1.043。与通过专业的特征工程处理的数据训练出的现有的模型相比,达到了一个不错的效果。
网络改进
我们从3个方面对网络进行改进:
- 数据的预处理
- Filter数量
- Kernel大小
数据预处理
我们先观察一下初始数据的分布。将原始数据去重(覆盖的那些部分),然后去掉窗口,把数据整合起来,通过以下代码,将每一个维度的分布可视化:
def plot_variable_distributions(trainX):
	# remove overlap
	cut = int(trainX.shape[1] / 2)
	longX = trainX[:, -cut:, :]
	# flatten windows
	longX = longX.reshape((longX.shape[0] * longX.shape[1], longX.shape[2]))
	print(longX.shape)
	pyplot.figure()
	xaxis = None
	for i in range(longX.shape[1]):
		ax = pyplot.subplot(longX.shape[1], 1, i+1, sharex=xaxis)
		ax.set_xlim(-1, 1)
		if i == 0:
			xaxis = ax
		pyplot.hist(longX[:, i], bins=100)
	pyplot.show()

# load data
trainX, trainy, testX, testy = load_dataset()
# plot histograms
plot_variable_distributions(trainX)
代码将以此顺序绘制分布图:
Total Acceleration x
Total Acceleration y
Total Acceleration z
Body Acceleration x
Body Acceleration y
Body Acceleration z
Body Gyroscope x
Body Gyroscope y
Body Gyroscope z

可以看到,除了Total Acceleration x,其他的特征都基本服从高斯分布,而Total Acceleration x看起来更加扁平。我们可以尝试将数据进行标准化。这里用sklearn的StandardScaler来实现:
# standardize data
def scale_data(trainX, testX, standardize):
	# remove overlap
	cut = int(trainX.shape[1] / 2)
	longX = trainX[:, -cut:, :]
	# flatten windows
	longX = longX.reshape((longX.shape[0] * longX.shape[1], longX.shape[2]))
	# flatten train and test
	flatTrainX = trainX.reshape((trainX.shape[0] * trainX.shape[1], trainX.shape[2]))
	flatTestX = testX.reshape((testX.shape[0] * testX.shape[1], testX.shape[2]))
	# standardize
	if standardize:
		s = StandardScaler()
		# fit on training data
		s.fit(longX)
		# apply to training and test data
		longX = s.transform(longX)
		flatTrainX = s.transform(flatTrainX)
		flatTestX = s.transform(flatTestX)
	# reshape
	flatTrainX = flatTrainX.reshape((trainX.shape))
	flatTestX = flatTestX.reshape((testX.shape))
	return flatTrainX, flatTestX
再更新下evaluate_model(),run_experiment(),summarize_results():
# fit and evaluate a model
def evaluate_model(trainX, trainy, testX, testy, param):
	verbose, epochs, batch_size = 0, 10, 32
	n_timesteps, n_features, n_outputs = trainX.shape[1], trainX.shape[2], trainy.shape[1]
	# scale data
	trainX, testX = scale_data(trainX, testX, param)
	model = Sequential()
	model.add(Conv1D(filters=64, kernel_size=3, activation='relu', input_shape=(n_timesteps,n_features)))
	model.add(Conv1D(filters=64, kernel_size=3, activation='relu'))
	model.add(Dropout(0.5))
	model.add(MaxPooling1D(pool_size=2))
	model.add(Flatten())
	model.add(Dense(100, activation='relu'))
	model.add(Dense(n_outputs, activation='softmax'))
	model.compile(loss='categorical_crossentropy', optimizer='adam', metrics=['accuracy'])
	# fit network
	model.fit(trainX, trainy, epochs=epochs, batch_size=batch_size, verbose=verbose)
	# evaluate model
	_, accuracy = model.evaluate(testX, testy, batch_size=batch_size, verbose=0)
	return accuracy

# run an experiment
def run_experiment(params, repeats=10):
	# load data
	trainX, trainy, testX, testy = load_dataset()
	# test each parameter
	all_scores = list()
	for p in params:
		# repeat experiment
		scores = list()
		for r in range(repeats):
			score = evaluate_model(trainX, trainy, testX, testy, p)
			score = score * 100.0
			print('>p=%d #%d: %.3f' % (p, r+1, score))
			scores.append(score)
		all_scores.append(scores)
	# summarize results
	summarize_results(all_scores, params)

# summarize scores
def summarize_results(scores, params):
	print(scores, params)
	# summarize mean and standard deviation
	for i in range(len(scores)):
		m, s = mean(scores[i]), std(scores[i])
		print('Param=%d: %.3f%% (+/-%.3f)' % (params[i], m, s))
	# boxplot of scores
	pyplot.boxplot(scores, labels=params)
	pyplot.savefig('exp_cnn_standardize.png')
运行:
# run the experiment
n_params = [False, True]
run_experiment(n_params)
(7352, 128, 9) (7352, 1)
(2947, 128, 9) (2947, 1)
(7352, 128, 9) (7352, 6) (2947, 128, 9) (2947, 6)
>p=0 #1: 88.904
>p=0 #2: 90.702
>p=0 #3: 90.770
>p=0 #4: 89.820
>p=0 #5: 91.381
>p=0 #6: 91.517
>p=0 #7: 86.597
>p=0 #8: 90.261
>p=0 #9: 87.750
>p=0 #10: 90.601
>p=1 #1: 91.686
>p=1 #2: 89.175
>p=1 #3: 91.177
>p=1 #4: 92.094
>p=1 #5: 91.008
>p=1 #6: 90.126
>p=1 #7: 90.601
>p=1 #8: 89.650
>p=1 #9: 92.195
>p=1 #10: 90.567
[[88.90397013912454, 90.70240922972515, 90.77027485578554, 89.82015609093995, 91.38106549032915, 91.51679674244994, 86.59653885307091, 90.26128266033254, 87.75025449609772, 90.60061079063453], [91.68646080760095, 89.17543264336614, 91.17746861214795, 92.09365456396336, 91.00780454699695, 90.12555140821175, 90.60061079063453, 89.65049202578894, 92.19545300305396, 90.56667797760434]] [False, True]
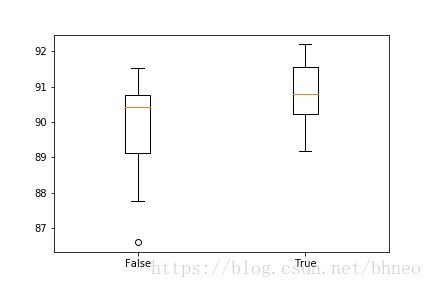
Param=0: 89.830% (+/-1.527)
Param=1: 90.828% (+/-0.954)
可以看到标准化后的平均准确率上升了大概一个百分点。折是评估分数的分布:

Filter数量
我们尝试多个Filter数:
n_params = [8, 16, 32, 64, 128, 256]
更新代码并运行:
# fit and evaluate a model
def evaluate_model(trainX, trainy, testX, testy, n_filters):
	verbose, epochs, batch_size = 0, 10, 32
	n_timesteps, n_features, n_outputs = trainX.shape[1], trainX.shape[2], trainy.shape[1]
	model = Sequential()
	model.add(Conv1D(filters=n_filters, kernel_size=3, activation='relu', input_shape=(n_timesteps,n_features)))
	model.add(Conv1D(filters=n_filters, kernel_size=3, activation='relu'))
	model.add(Dropout(0.5))
	model.add(MaxPooling1D(pool_size=2))
	model.add(Flatten())
	model.add(Dense(100, activation='relu'))
	model.add(Dense(n_outputs, activation='softmax'))
	model.compile(loss='categorical_crossentropy', optimizer='adam', metrics=['accuracy'])
	# fit network
	model.fit(trainX, trainy, epochs=epochs, batch_size=batch_size, verbose=verbose)
	# evaluate model
	_, accuracy = model.evaluate(testX, testy, batch_size=batch_size, verbose=0)
	return accuracy

# summarize scores
def summarize_results(scores, params):
	print(scores, params)
	# summarize mean and standard deviation
	for i in range(len(scores)):
		m, s = mean(scores[i]), std(scores[i])
		print('Param=%d: %.3f%% (+/-%.3f)' % (params[i], m, s))
	# boxplot of scores
	pyplot.boxplot(scores, labels=params)
	pyplot.savefig('exp_cnn_filters.png')

# run an experiment
def run_experiment(params, repeats=10):
	# load data
	trainX, trainy, testX, testy = load_dataset()
	# test each parameter
	all_scores = list()
	for p in params:
		# repeat experiment
		scores = list()
		for r in range(repeats):
			score = evaluate_model(trainX, trainy, testX, testy, p)
			score = score * 100.0
			print('>p=%d #%d: %.3f' % (p, r+1, score))
			scores.append(score)
		all_scores.append(scores)
	# summarize results
	summarize_results(all_scores, params)

# run the experiment
n_params = [8, 16, 32, 64, 128, 256]
run_experiment(n_params)
得到结果:
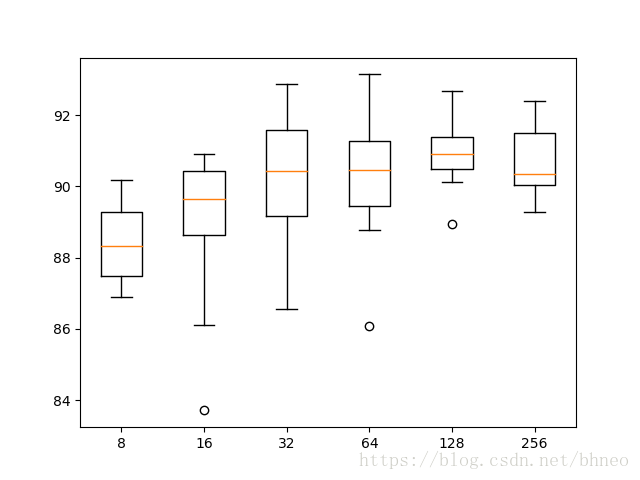
Param=8: 88.497% (+/-1.124)
Param=16: 88.890% (+/-2.194)
Param=32: 90.183% (+/-1.868)
Param=64: 90.268% (+/-1.824)
Param=128: 90.916% (+/-0.960)
Param=256: 90.699% (+/-1.018)
Kernel大小
尝试将kernel大小调整为:
n_params = [2, 3, 5, 7, 11]
更新代码并运行:
# fit and evaluate a model
def evaluate_model(trainX, trainy, testX, testy, n_kernel):
	verbose, epochs, batch_size = 0, 15, 32
	n_timesteps, n_features, n_outputs = trainX.shape[1], trainX.shape[2], trainy.shape[1]
	model = Sequential()
	model.add(Conv1D(filters=64, kernel_size=n_kernel, activation='relu', input_shape=(n_timesteps,n_features)))
	model.add(Conv1D(filters=64, kernel_size=n_kernel, activation='relu'))
	model.add(Dropout(0.5))
	model.add(MaxPooling1D(pool_size=2))
	model.add(Flatten())
	model.add(Dense(100, activation='relu'))
	model.add(Dense(n_outputs, activation='softmax'))
	model.compile(loss='categorical_crossentropy', optimizer='adam', metrics=['accuracy'])
	# fit network
	model.fit(trainX, trainy, epochs=epochs, batch_size=batch_size, verbose=verbose)
	# evaluate model
	_, accuracy = model.evaluate(testX, testy, batch_size=batch_size, verbose=0)
	return accuracy

# summarize scores
def summarize_results(scores, params):
	print(scores, params)
	# summarize mean and standard deviation
	for i in range(len(scores)):
		m, s = mean(scores[i]), std(scores[i])
		print('Param=%d: %.3f%% (+/-%.3f)' % (params[i], m, s))
	# boxplot of scores
	pyplot.boxplot(scores, labels=params)
	pyplot.savefig('exp_cnn_kernel.png')

# run an experiment
def run_experiment(params, repeats=10):
	# load data
	trainX, trainy, testX, testy = load_dataset()
	# test each parameter
	all_scores = list()
	for p in params:
		# repeat experiment
		scores = list()
		for r in range(repeats):
			score = evaluate_model(trainX, trainy, testX, testy, p)
			score = score * 100.0
			print('>p=%d #%d: %.3f' % (p, r+1, score))
			scores.append(score)
		all_scores.append(scores)
	# summarize results
	summarize_results(all_scores, params)

# run the experiment
n_params = [2, 3, 5, 7, 11]
run_experiment(n_params)
得到结果:
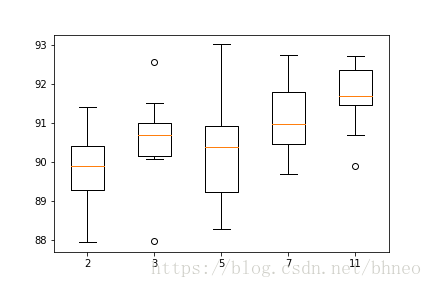
Param=2: 89.769% (+/-1.035)
Param=3: 90.580% (+/-1.115)
Param=5: 90.312% (+/-1.433)
Param=7: 91.089% (+/-0.978)
Param=11: 91.656% (+/-0.829)

从评估结果的分布来看,11得到了较好的准确率以及较低的方差。
多端输入卷积网络
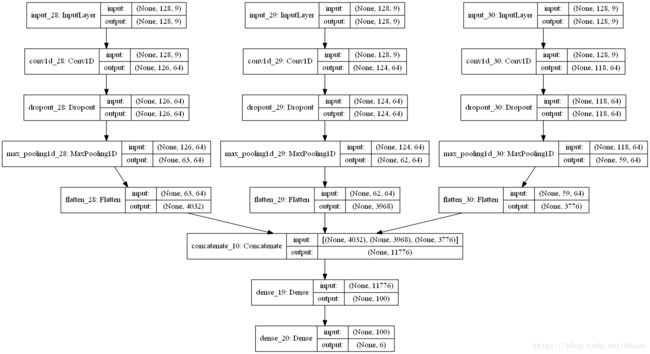
最后,再尝试一中多端输入的卷积网络,其每个输入端读取同样的数据,但是使用不同大小的kernel(3,5,11)。然后,将他们拼接,输入到一个全连接层,再到输出层。

更新代码并运行(也可以考虑尝试不同的参数,如不同的filter数量):
# fit and evaluate a model
def evaluate_model(trainX, trainy, testX, testy):
	verbose, epochs, batch_size = 0, 10, 32
	n_timesteps, n_features, n_outputs = trainX.shape[1], trainX.shape[2], trainy.shape[1]
 	# head 1
	inputs1 = Input(shape=(n_timesteps,n_features))
	conv1 = Conv1D(filters=64, kernel_size=3, activation='relu')(inputs1)
	drop1 = Dropout(0.5)(conv1)
	pool1 = MaxPooling1D(pool_size=2)(drop1)
	flat1 = Flatten()(pool1)
	# head 2
	inputs2 = Input(shape=(n_timesteps,n_features))
	conv2 = Conv1D(filters=64, kernel_size=5, activation='relu')(inputs2)
	drop2 = Dropout(0.5)(conv2)
	pool2 = MaxPooling1D(pool_size=2)(drop2)
	flat2 = Flatten()(pool2)
	# head 3
	inputs3 = Input(shape=(n_timesteps,n_features))
	conv3 = Conv1D(filters=64, kernel_size=11, activation='relu')(inputs3)
	drop3 = Dropout(0.5)(conv3)
	pool3 = MaxPooling1D(pool_size=2)(drop3)
	flat3 = Flatten()(pool3)
	# merge
	merged = concatenate([flat1, flat2, flat3])
	# interpretation
	dense1 = Dense(100, activation='relu')(merged)
	outputs = Dense(n_outputs, activation='softmax')(dense1)
	model = Model(inputs=[inputs1, inputs2, inputs3], outputs=outputs)
	# save a plot of the model
	plot_model(model, show_shapes=True, to_file='multichannel.png')
	model.compile(loss='categorical_crossentropy', optimizer='adam', metrics=['accuracy'])
	# fit network
	model.fit([trainX,trainX,trainX], trainy, epochs=epochs, batch_size=batch_size, verbose=verbose)
	# evaluate model
	_, accuracy = model.evaluate([testX,testX,testX], testy, batch_size=batch_size, verbose=0)
	return accuracy

# summarize scores
def summarize_results(scores):
	print(scores)
	m, s = mean(scores), std(scores)
	print('Accuracy: %.3f%% (+/-%.3f)' % (m, s))

# run an experiment
def run_experiment(repeats=10):
	# load data
	trainX, trainy, testX, testy = load_dataset()
	# repeat experiment
	scores = list()
	for r in range(repeats):
		score = evaluate_model(trainX, trainy, testX, testy)
		score = score * 100.0
		print('>#%d: %.3f' % (r+1, score))
		scores.append(score)
	# summarize results
	summarize_results(scores)

# run the experiment
run_experiment()
得到结果:
(7352, 128, 9) (7352, 1)
(2947, 128, 9) (2947, 1)
(7352, 128, 9) (7352, 6) (2947, 128, 9) (2947, 6)
>#1: 92.365
>#2: 91.822
>#3: 92.229
>#4: 91.924
>#5: 91.958
>#6: 91.924
>#7: 93.349
>#8: 92.806
>#9: 91.924
>#10: 93.010
[92.36511706820495, 91.82219205972176, 92.22938581608415, 91.92399049881234, 91.95792331184255, 91.92399049881234, 93.34916864608076, 92.80624363759755, 91.92399049881234, 93.00984051577876]
Accuracy: 92.331% (+/-0.513)
跟之前相比,效果进一步得到了提升。
引用
How to Develop 1D Convolutional Neural Network Models for Human Activity Recognition , Jason Brownlee
