Vehicle Color Recognition on Urban Road by Feature Context
Vehicle Color Recognition on Urban Road by Feature Context
Pan Chen, Xiang Bai and Wenyu Liu
Institute of Electrical and Electronics Engineers,IEEE [Eye-triple-E]
transaction [træn'zækʃ(ə)n; trɑːn-; -'sæk-]:n. 交易,事务,办理,会报,学报
intelligent transportation system,ITS
corresponding author:通讯作者
Huazhong University of Science and Technology,HUST:华中科技大学
counterfeit ['kaʊntəfɪt; -fiːt]:vt. 伪造,仿造,假装,伪装 vi. 仿造,假装 n. 赝品,冒牌货,伪造品 adj. 假冒的,伪造的,虚伪的
National Natural Science Foundation of China,NSFC:国家自然科学基金委员会
Abstract
Vehicle information recognition is a key component of intelligent transportation systems. Color plays an important role in vehicle identification. As a vehicle has its inner structure, the main challenge of vehicle color recognition is to select the region of interest (ROI) for recognizing its dominant color. In this paper, we propose a method to implicitly select the ROI for color recognition. Preprocessing is performed to overcome the influence of image quality degradation. Then, the ROI in vehicle images is selected by assigning the subregions with different weights that are learned by a classifier trained on the vehicle images. We train the classifier by linear support vector machine for its efficiency and high precision. The experiments are extensively validated on both images and videos, which are collected on urban roads. The proposed method outperforms other competing color recognition methods.
intelligent transportation system,ITS:智能运输系统
key component:主要组成部份,关键组分
vehicle identification:车辆识别
inner structure:内部结构
region of interest,ROI:感兴趣区域
dominant ['dɒmɪnənt]:adj. 显性的,占优势的,支配的,统治的 n. 显性
degradation [,degrə'deɪʃ(ə)n]:n. 退化,降格,降级,堕落
implicitly [ɪm'plɪsɪtlɪ]:adv. 含蓄地,暗中地
Index Terms
Color recognition, region of interest (ROI), vehicle.
I. INTRODUCTION
As an important part of intelligent transportation systems (ITS) or Smart City, vehicle information recognition has received much attention in recent years. The information of a vehicle is very helpful for video surveillance and many applications of city public security. Color is one of the most dominant cues for vehicle identification. Vehicle color recognition in natural scenes can provide useful information in vehicle detection [1], [2], vehicle tracking [3] and automatic driving system [4]-[7]. However, it is a challenging task to recognize the colors of vehicles in images/videos due to the following difficulties.
dominant ['dɒmɪnənt]:adj. 显性的,占优势的,支配的,统治的 n. 显性
cue [kjuː]:n. 提示,暗示,线索 vt. 给...暗示
- Color can be easily influenced by the change of natural environment. For example, haze, snow, and other illumination changes may cause a significant color variation.
- The performance of color recognition is also limited by the low quality of images/videos, which are affected by noise, overexposure, and color shift in natural images.
- As different parts of a vehicle have different colors, it is necessary to choose the appropriate regions for vehicle color recognition. The color of the vehicle body is usually more informative and discriminative than other parts, such as windows, wheels, etc. Thus, in this paper, we focus on the vehicle body for recognizing the dominant color. However, determining the focused region of a vehicle is a critical issue.
haze [heɪz]:n. 阴霾,薄雾,疑惑 vt. 使变朦胧,使变糊涂 vi. 变朦胧,变糊涂
overexposure [,əʊvəɪks'pəʊʒə]:n. 感光过度,曝光过度
Before recognizing the colors of vehicles, localizing their positions in images/videos is an essential step. Several well-known detection approaches [8]-[11] can provide an accurate bounding box for each vehicle. Thus, our color recognition is performed in the detected bounding boxes of vehicles. In this paper, both our training and testing images are collected by a vehicle detector.
essential [ɪ'senʃ(ə)l]:adj. 基本的,必要的,本质的,精华的 n. 本质,要素,要点,必需品
In object/image color recognition, the color features are collected from image patches. Then, a classifier is trained for color recognition. Wang et al. [12] investigated the effectiveness of multiple support vector machine (SVM) recursive feature elimination for feature selection in the classification of lip color. Zheng et al. [13] described an automatic low-cost method based on SVM and color histogram for classifying lip colors. Son et al. [14] proposed a novel convolution kernel to extract the color information of vehicle images. Park and Kim [15] proposed a method for color classification of objects with two techniques of dimension reduction: 1) projecting a color histogram generated from a 3-D colorspace into 2-D; and 2) converting the color histograms to class-based features by a naive Bayesian classifier. Wang et al. [16] adopted the hue saturation value color space for the color recognition of license plates. However, the methods above cannot be applied to the task of vehicle color recognition due to the lack of region-of-interest (ROI) selection.
recursive [rɪ'kɜːsɪv]:adj. 递归的,循环的
lip [lɪp]:n. 嘴唇,边缘 vt. 以嘴唇碰 adj. 口头上的 vi. 用嘴唇
naive Bayes classifier:朴素贝叶斯分类器
region of interest,ROI:感兴趣区域
hue [hjuː]:n. 色彩,色度,色调,叫声
saturation [sætʃə'reɪʃ(ə)n]:n. 饱和,色饱和度,浸透
In the general framework of object/image color recognition, the color feature plays an important role. Qiu et al. [17] investigated the redundancy and performance of histogram based color descriptors in the context of automatic color photo categorization. Kender [18] proposed a descriptor based on a new color space named normalized RGB. Van de Sande et al. [19] surveyed popular color descriptors and analyze their invariance to illumination change and color shift. Illumination change and color shift are described as a linear model. Huang et al. [20] developed a descriptor named color correlogram for the indexing and comparison of images. Correlogram is a table indexed by color pairs. These features only contain the spatial information of different color types, not the object or the scene.
redundancy [rɪ'dʌnd(ə)nsɪ];n. 冗余,裁员,人浮于事
illumination [ɪ,ljuːmɪ'neɪʃən]:n. 照明,照度,启发,灯饰,阐明
correlogram [kə'reləgræm]:n. 相关图
As the spatial information of object and scene can be described by bag-of-word (BoW)-based methods [21]–[23], we adopt the framework of BoW in our method. The BoW is first used in object and scene retrieval by Sivic and Zisserman [24]. The original feature is encoded by a codebook, which is learned from a set of features by clustering algorithm. Lazebnik et al. [21] extended the original BoW method with spatial information. Motivated by the classic shape descriptor shape context [25], Wang et al. [23] proposed feature context (FC), which divides a image into several fan-shape-like subregions in the log-polar coordinate system. Combined with radial basis coding (RBC) [23] and reference points, FC outperforms spatial pyramid matching (SPM) [21] in scene categorization. Recently, Bolovinou et al. [26] has presented a novel approach to encode the spatial configurations of visual words in order to add context information in the representation. The method introduces a bag of spatio-visual words representation obtained by clustering visual words correlogram ensembles and shows a significant improvement over the state-of-the-art BoW model. However, all these BoW-based methods focus on scene recognition. They cannot be directly applied to vehicle color recognition because the local feature describes the texture, rather than the color information of a patch.
log-polar:对数极坐标
categorization [,kætəgərɪ'zeʃən]:n. 分类,分门别类,编目方法
ensemble [ɒn'sɒmb(ə)l]:n. 全体,总效果,全套服装,全套家具,合奏组 adv. 同时
Since the vehicle has its specific inner structure and different parts may be in different colors, it requires us to recognize the dominant color of a vehicle. For example, we are more interested in the color of vehicle body than other parts such as wheels or windows. Thus, it is very important to select the region of interest (ROI) of a vehicle for color recognition. We propose a BoW-based method to solve the problem. The BoW representation can map the color features into a higher dimensional subspace by quantizing them using a large codebook, in which different color types are separated more easily by a classifier such as SVM. The flowchart is shown in Fig. 1. The vehicle image is cropped via a detector first. FC, which utilizes fanlike subregions, shows much better performance in scene recognition than that of the SPM method [21], which uses rectangular blocks. In our application, by setting multiple reference points, FC can generate many subregions with the irregular shapes on a vehicle. We train a linear SVM as our classifier.
irregular [ɪ'regjʊlə];n. 不规则物,合规格的产品 adj. 不规则的,无规律的,非正规的,不合法的
quantize ['kwɒntaɪz]:vt. 使量子化,数字转换
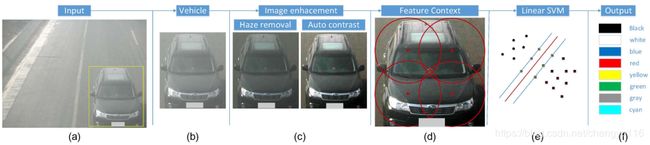
Fig. 1. Framework of our method. (a) Original image. (b) Output of vehicle detection in (a). © Results of haze removal and color contrast stretch. (d) Description of image by FC. (e) Training/testing by linear SVM. (f) Output of vehicle color recognition.
The contributions of our method are threefold: First, we solve the problem of vehicle color recognition using the BoW model, which has not been applied to this topic yet. The BoW model is very common in object detection, scene recognition, image retrieval, etc. To our knowledge, this is the first study of vehicle color recognition based on BoW. Since the representation of BoW is more discriminative after mapping the original features to a higher dimension using a codebook, the BoW-based color feature achieves the better performance in vehicle color recognition. Second, the ROI is implicitly selected by our method. To select the ROI of a vehicle, we do not explicitly segment it into subregions of different colors. Instead, FC divides the image into fan-like subregions from which the local color features are collected. The ROI can be selected by assigning the weights of a SVM classifier to subregions. Third, we generate a vehicle data set with images and videos. Each vehicle in our data set is labeled with its color, brand, bounding box (for training a vehicle detector), and category. The data set can be helpful for others in the various applications of ITS, such as vehicle detection, vehicle color recognition, and vehicle brand recognition.
threefold ['θriːfəʊld]:adj. 三倍的,三重的,有三部分的 adv. 三重地,三倍地
implicitly [ɪm'plɪsɪtlɪ]:adv. 含蓄地,暗中地
explicitly [ɪk'splɪsɪtli]:adv. 明确地,明白地
The rest of this paper is organized as follows. In Section II, we introduce the details of our method, which includes the preprocessing and representation of images. The experiment results on images and videos are presented and discussed in Section III. Section IV is the conclusion of this paper.
II. APPROACH
Here, the details of our method are introduced as follows.
A. Preprocessing
The quality of the images/videos taken by the cameras on urban roads is usually poor due to the impact of haze, strong light, and color shift caused by bad weather conditions or inappropriate configuration of equipment. The poor quality is a challenge for color recognition. In order to overcome the influences, we adopt the haze removal method [27] and color contrast method [28] as the preprocessing in our method.
inappropriate [ɪnə'prəʊprɪət];adj. 不适当的,不相称的
The results of the preprocessing are shown in Fig. 1(b) and ©. In Fig. 1(b), the original image is under thick haze that makes the color of the vehicle biased to gray. After the haze removal, the image is much clearer. The quality of the image can be improved further using a color contrast stretch. We apply haze removal first in the preprocessing, since the color contrast stretch cannot significantly improve the quality of the images under thick haze. The dominant color of the vehicle image is more obvious after the haze removal algorithm and the color contrast stretch method.
contrast stretch:对比度拉伸,对比度扩展 (一种线性的灰度变换)
B. Image Color Representation by FC
The color features of patches are extracted from the enhanced images. Following the framework of FC [23], the color features are encoded as histograms based on the visual words in a codebook. The encoded features are aggregated into one vector by pooling function to describe a region. The details are introduced as follows.
aggregated ['ægrigitid]:adj. 聚合的,合计的
The patch features are important as they describe local color information, which affects the performance of our method significantly. Van de Sande et al. [19] surveyed the current color histograms and analyze their robustness to illumination change and color shift. The histograms include transformed color histogram [19], hue histogram [29], opponent histogram [19], normalized RG histogram [30], and RGB histogram. Their abilities to overcome the illumination change and color shift are different. However, the robustness analysis in [19] is not reliable for our task, since the changes in color shift and the illumination in the natural scene are sophisticated and cannot be described by a simple model in [19]. Thus, in order to keep the merit of each local color feature, we combine transformed color histogram, hue histogram, opponent histogram, normalized RG histogram, and color moment [19] together as our patch feature. The total dimension is 211 (= 48 + 62 + 48 + 32 + 21).
sophisticate [sə'fɪstɪkeɪt]:vt. 弄复杂,使变得世故,曲解 n. 久经世故的人,精通者 vi. 诡辩
In our method, the patches are densely sampled. In a given image I I I, the features of patches are denoted by Z = z 1 , . . . , z L Z = {z_{1}, ... , z_{L}} Z=z1,...,zL. Each patch feature z ∈ Z z \in Z z∈Z is encoded as a vector C ( z ) = ( w 1 z , . . . , w K z ) C(z) = (w_{1}^{z}, . . . , w_{K}^{z}) C(z)=(w1z,...,wKz). The vector has the same size as the codebook S S S. The codebook S S S is learned from the patch features in the training data set by clustering method. We use K K K-means in this paper. The visual words of the codebook are the centers of K K K clusters S 1 , S 2 , . . . , S K {S_{1}, S_{2}, ... ,S_{K}} S1,S2,...,SK. Recent coding approaches [22], [31], [32] have been applied in our method. We choose RBC [23] as our coding method. The RBC obtains the state-of-the-art performance in scene recognition. The activation strength is measured with a Gaussian function

where μ i μ_i μi is the center of the cluster S i S_i Si, and σ i σ_i σi is the standard deviation of the distances between S i S_i Si and μ i μ_i μi. N N ( x ) NN(x) NN(x) denotes a set of nearest neighbors of x x x. We restrict the activation to N N ( x ) NN(x) NN(x) for efficiency reasons. The number of nearest neighbors is set to 5 in Section III.
We take the representation of FC [23] to describe the image. FC divides the image into fan-like subregions. The value of each histogram bin of FC is a histogram of the color features. The partitions of subregions of FC are illustrated in Fig. 2. Let p p p be the location of a reference point in I I I. The area around p p p is divided into subregions R e g i o n r θ Region^{θ}_{r} Regionrθ in log-polar coordinate system for r = 1 , . . . , R , θ = π / N , . . . , π r = 1, ... , R, \theta = π/N, ... , π r=1,...,R,θ=π/N,...,π, where R R R and N N N are the number of the bins in radius and angle, respectively. Our FC representation for the reference point p p p is defined as follows:

where i i i indexes the i i ith codeword ( i = 1 , . . . , K i = 1, ... , K i=1,...,K). The feature of fan-like subregions are described by the pooling function M M M, which extracts the most relevant codewords in the region. The function M can be max, sum, mean, or some other functions. We use the max pooling in our method since it outperforms the others according to [33]. In order to get more precise representation and the spatial information of a vehicle, we set multiple reference points P = p 1 , p 2 , . . . , p L P = {p_{1}, p_{2}, ... , p_{L}} P=p1,p2,...,pL. As an example of the configuration of the reference points in Fig. 2(b), the image is divided into four subregions. Each subregion that belongs to a reference point is described by FC illustrated in Fig. 2(a). Therefore, the feature of an image I I I is a tensor of L × R × N × K L × R × N × K L×R×N×K dimension given by
![]()

Fig. 2. Illustration of FC. (a) Description of FC of fan-shape-like subregions. (b) Configuration of four reference points.
Linear SVM is trained for color recognition of vehicle images. Although nonlinear SVM generally outperforms linear SVM, it takes more time to train a model. We chose the implementation of LibLinear [34] to solve the multiclass classification problem.
III. EXPERIMENTAL EVALUATION
To fully evaluate the performance of the proposed method, extensive experiments are conducted on the images and the videos collected on urban roads. The proposed algorithm is implemented in C++ on a Windows 7 × 64-based system. The experiments are carried out on a desktop machine with an Intel® Core™ i7-2600 K CPU (3.40 GHz) and 8-GB memory. We divide the colors of vehicles into eight classes, including black, white, blue, yellow, green, red, gray, and cyan. Linear SVM is used in our method for color classification.
cyan ['saɪən];n. 蓝绿色 adj. 蓝绿色的
A. Evaluated Data Sets
Since there is no existing public benchmark for vehicle color recognition, we built two data sets for our experiments: a) a vehicle image data set; and b) a vehicle video data set. Both data sets are collected on urban roads, where the images and videos are taken in the frontal view captured by a high-definition camera with the resolution of 1920 × 1080. The collected data set is very challenging due to the noise caused by illumination variation, haze, and overexposure.
frontal ['frʌnt(ə)l]:adj. 额的,正面的,前面的 n. 额骨,额部,房屋的正面
The image data set contains 15 601 vehicle images of various categories, such as sedan, truck, and bus. The recognition rate is used to evaluate the performance of image based color recognition and defined as the ratio between the correctly predicted numbers and the totals.
sedan [sɪ'dæn]:n. 轿车,轿子
The video data set contains ten pieces of surveillance videos. The frame rate of all videos is 10 frames per second, and the average video length is about 5 min. We use an average recognition rate to evaluate the performance in video sequences. A frame is successfully recognized if all the vehicles appearing in the frame are assigned to the correct colors. Only the frames with vehicles are taken into account in the evaluation process.
piece [piːs]:n. 块,件,篇,硬币 vt. 修补,接合,凑合
B. Evaluation on Image Data set
Implementation Details: In our experiments, the data set is randomly divided into two groups, i.e., half for training and half for testing. The procedure is repeated for five times, and the final recognition rate is the average of all runs. All the vehicle images are resized to 300 × 300 for both training and testing. Our color histogram is a combination of transformed color histogram [19], hue histogram [29], opponent histogram [19], normalized RG histogram [30], and color moment [19] with a dimension of 211 (= 48 + 62 + 48 + 32 + 21). Local features are computed on an image patch with a grid of size 24 × 24 and a stride of 8 pixels. The codebook size is fixed to 512 in all the experiments. The parameters for FC are R = 1 and N = 6. The number of the reference points for FC is set as 4 for each vehicle image. Thus, each image is described by a 12 288-dimension feature (= 512 × 1 × 6 × 4).
opponent [ə'pəʊnənt]:n. 对手,反对者,敌手 adj. 对立的,敌对的
Performance Evaluation of Our Method and Comparisons: We adopt several conventional color features as the input for the classifier for comparison, including the global features such as color correlogram [20], layered color indexing [35], and the local patch features such as transformed color histogram [19], hue histogram [29], opponent histogram [19], normalized RG histogram [30], and RGB histogram. To demonstrate the advantage of BoW representation over other methods, these features and our color histogram are directly fed to the linear SVM, respectively, and the corresponding results are listed in the second and third rows of Table I. Note that, to provide a fair comparison, in all the experiments we use the linear SVM as the classifier. As shown in Table I, global features work much better than local patch features, including our color histogram. This is reasonable, since our color histogram is a combination of the local patch features without spatial information, whereas color correlogram [20] and layered color indexing [35] are facilitated by the spatial information of different color types.
reasonable ['riːz(ə)nəb(ə)l]:adj. 合理的,公道的,通情达理的
TABLE I
AVERAGE RECOGNITION PERFORMANCES OF DIFFERENT COLOR DESCRIPTORS ON IMAGE DATASET. EACH ROW LISTS THE PERFORMANCE OF CERTAIN COLOR DESCRIPTORS. COLUMNS SHOW A SPECIFIC RECOGNITION RATE OF DIFFERENT COLOR TYPES, AND THE AVERAGE OF THEM IS DISPLAYED IN THE LAST COLUMN

In addition, when we apply the BoW paradigm to the local patch features, the recognition rates are significantly improved, as shown in the fourth row of Table I. In the BoW paradigm, the local patch features are encoded by the RBC method at first. Then, the encoded local features of an image are aggregated by max pooling, establishing a holistic representation of the corresponding image. These results demonstrate that BoW representation brings more discriminative power after transforming the original color feature to a feature space of a higher dimension. The best results are obtained based on the BoW representation of our color histogram, since our combined feature can keep the merits of different features to overcome the influence caused by overexposure and color shift. In addition, different features can be weighted by learning with SVM.
paradigm ['pærədaɪm]:n. 范例,词形变化表
holistic [həʊ'lɪstɪk; hɒ-]:adj. 整体的,全盘的
In addition to the experiments on the BoW representation, we also examine the impact of two different ways of involving spatial information, i.e., SPM and FC. Their results are shown in the fifth and the last row of Table I, respectively. For SPM, the images are partitioned into 1 (= 1 × 1), 4 (= 2 × 2), 16 (= 4 × 4) rectangles, following the configuration in [21]. For each subregion, the encoded local features inside a certain rectangle are aggregated into a vector by max pooling as the representation of the corresponding region. Then the vector representations of all the subregions are concatenated into one to describe the color of a vehicle. As shown in Table I, both SPM and FC improve the performance of BoW, and FC slightly outperforms SPM. The best result in Table I is obtained by our method when integrating BoW representation of our color histogram with FC. Although color correlogram and layered color indexing also contain the spatial information, they cannot robustly capture the structure of a vehicle.
In our data set, the variances in green and gray are much larger than the others. As these two colors are less unified, their features are more scattered in the feature space and difficult to be classified. Thus, the recognition rates for these two colors are lower than that of the other color types in all the evaluated methods.
scatter ['skætə]:vi. 分散,散开,散射 vt. 使散射,使散开,使分散,使散播,使撒播 n. 分散,散播,撒播
When the preprocessing stage is removed in our method, the designed color descriptor still achieves promising results, as shown in Table II. This further demonstrates the robustness of our method against impacts such as color shift and haze. In addition, some other strategies such as principle component analysis (PCA) and coordinate augmented codebook (CAC) [36] can be also employed to enhance the performance of our system. PCA is often used for dimension reduction and helps eliminate the noise embedded in the original feature space. CAC is used to combine the appearance information and coordinate of a patch into a feature vector. Due to the constraint of the location, the patches with the same coordinates are assigned in one cluster center. Thus, the features of the subregions of different locations are encoded by the different codewords. The dimension of the proposed color descriptor is reduced from 211 to 100 by PCA in our practice. In Table II, we observe that both PCA and CAC are able to improve the performance of our descriptor. As the structure of our vehicle images is fixed to some extent, various codewords for different subregions make the features more discriminative. The combination of PCA and CAC leads to the highest accuracy, as shown in the last row of Table II.
codeword ['kodwɝd]:n. 代码字,代号
To illustrate our method more intuitively, the selected ROI is presented in Fig. 3. More discriminative subregions are attached with a higher opacity (see Fig. 3). The property is determined by the product of the SVM weight and the feature vector of the region. As shown in Fig. 3(a), the regions of window and background are less considered in the color prediction process, whereas the engine hood tends to be more dominant in color decision. For different categories of vehicles, the structures in the frontal view are similar. Our method can perform successful color recognitions of the different categories under mild structure variances.
engine hood:发动机罩;引擎罩
TABLE II
AVERAGE PERFORMANCE COMPARISONS USING DIFFERENT STRATEGIES. THE STRATEGIES TAKEN LIE IN DIFFERENT STAGES OF OUR METHOD SUCH AS IMAGE PREPROCESSING, FEATURE POSTPROCESSING, AND THE EMPLOYED CLASSIFIERS

For side-view vehicle images, the model trained from the frontal view may not make the correct predictions due to the different structure of the ROI. To verify the proposed method on side-view vehicles, we collected 240 side-view vehicle images (30 per class) by Google from the Internet and use half for training and half for testing. With the same experimental settings of the frontal view images, we achieve the recognition rate of 0.8700, which demonstrates the potential of the proposed method on side-view vehicles. Two examples about the ROI selection of side-view vehicle images are shown in Fig. 3(b).

Fig. 3. ROI selected implicitly by our method. The higher opacity means the corresponding subregion is more discriminative. (a) ROI of the frontal view vehicle images. (b) The ROI of the side-view vehicle images.
frontal ['frʌnt(ə)l]:adj. 额的,正面的,前面的 n. 额骨,额部,房屋的正面
opacity [ə(ʊ)'pæsɪtɪ]:n. 不透明,不传导,暧昧

Fig. 4. Some samples of vehicle color recognition on videos.
Discussion on System Configurations: Here, we analyze the performance of FC in different system configurations (see Fig. 4). The experiments inspect the influences of the number of partitions in radial and angle, i.e., R R R and N N N, the number of reference point N r p N_{rp} Nrp, and the overlapped ratios between rectangular subregions. The efficiency of coding methods, namely, vector quantization (VQ) and RBC, are also presented. The codebook size is set as 512 according to the description in Section III-B1.
radial ['reɪdɪəl]:adj. 半径的,放射状的,光线的,光线状的 n. 射线,光线
The impacts of parameters R R R, N N N, and N r p N_{rp} Nrp are shown in Fig. 5. The number of subregions is the product of R R R, N N N, and N r p N_{rp} Nrp (see Fig. 5). Our method achieves a recognition rate of 0.9229, with eight angle partitions, two radial partitions, and four reference points. With the number of subregions increasing, the precision rises at first and then declines. The smaller subregions make the representation of the image too trivial and sensitive to intraclass variance. The larger regions have good generalization property but poor capability in discrimination. Additionally, the length of the feature vector becomes larger when the number of the subregions increases. The mentioned configuration of our method is set to make a tradeoff between the performance and efficiency.
partition [pɑː'tɪʃ(ə)n];n. 划分,分开,分割,隔墙,隔离物 vt. 分割,分隔,区分
trivial ['trɪvɪəl]:adj. 不重要的,琐碎的,琐细的
sensitive ['sensɪtɪv]:adj. 敏感的,感觉的,灵敏的,感光的,易受伤害的,易受影响的 n. 敏感的人,有灵异能力的人
tradeoff ['tred,ɔf]:n. 权衡,折衷,交易
intraclass variance:组内方差
increase [ɪn'kriːs]:n. 增加,增长,提高 vi. 增加,增大,繁殖 vt. 增加,加大

Fig. 5. Average recognition rates of the different settings for our methods. The parameters in the settings contains the number of reference points N r p N_rp Nrp, the number of partition in radial R R R, and the number of partition in angle N N N. The overlap is the ratio between the sizes of the overlapping area and the subregion.
We run the experiments on different subregions overlap ratios of 0, 0.25, 0.5, 0.75, and 0.85. The images are resized into 300 × 300 and divided into 1 × 1, 2 × 2, and 4 × 4 rectangle subregions in spatial pyramids. The size of subregions in level 1 × 1 is the same with the whole image. In the levels of 2 × 2 and 4 × 4, the sizes of the subregions are 150, 188, 225, 263, and 278, and 75, 94, 113, 131, and 139, respectively. Fig. 5 shows that the best result achieved by an SPM-based method is still inferior to that of our method. It suggests that the fan-like subregion is more appropriate for vehicle color recognition. The precision increases when the overlap ratio increases from 0 to 0.75. However, the recognition rate decreases when the overlap ratio is higher than 0.75. This can be addressed by the fact that the feature extracted from large partitions is not able to capture the local information, thus losing the discriminative power.
inferior [ɪn'fɪərɪə]:adj. 差的,自卑的,下级的,下等的 n. 下级,次品
As the number of subregions increases, the image becomes overpartitioned, and the discriminative power of the descriptor decreases. In addition, the size of image representation becomes larger, which increases the computation complexity. In our experiment, the image is partitioned into 1 × 1, 2 × 2, 4 × 4, and 8 × 8 rectangular subblocks without overlap. The sizes of subregions in four levels are 300, 150, 75, and 38. The proposed setting of subregions achieves a recognition rate of 0.8916.
To test the computational efficiency of the coding step in our method, we use a codebook of size 512 and 1156 local color features. The running time is the average of ten loops. The procedure of VQ and RBC take 0.0271 and 0.0531 s, respectively. The RBC is slower because it involves the operation of applying Gaussian kernel. We show that the step of coding has limited impact on the total color recognition time in the following video experiment.
vector quantization,VQ:矢量量化
Robustness Against Noises: In order to verify the robustness of our method, five levels of Gaussian noise are added to the training and test images in the conducted experiments. The average SNR of the noise on the images are 12.94, 10.09, 6.22, 3.33, 1.02, and -0.43 dB, respectively. In this experiment, all the parameter settings are consistent with Section III-B1. The recognition rate increases as SNR rises. The lowest rate is 0.8960 under the noise of SNR -0.43 dB. However, our method still outperforms several methods listed in Table I. This demonstrates our method can overcome the influence of the noise to a certain degree.
signal-to-noise ratio,SNR or S/N

Fig. 6. The average recognition rate of our method under the different levels of noise.
C. Evaluation on Video Sequences
We collect 10081 vehicle images from six pieces of videos as the training samples. The other four pieces of videos are for testing. For a vehicle image, the features are extracted from the images following the settings of Section III-B1. In the video testing, the image patches of the vehicles in the videos are cropped by the detection and tracking system.
The number of the frames in which vehicles of the frontal view are detected is 6547. The average per-frame recognition rate of eight color types is 0.9491. Thus, the performance of our method on video sequences is also encouraging. Fig. 4 shows some samples of the vehicle color recognition results on video sequences. In our experiment, the performance of vehicle color recognition is affected by the vehicle detection results, particularly when the vehicle image is incomplete or contains a large proportion of background. By setting a high threshold in the vehicle detection process, the precision of detection can be increased, thus boosting the performance of color recognition. On average, it costs 0.5 seconds per frame for detection and recognition, suggesting that our method can be applied on videos efficiently.
encourage [ɪn'kʌrɪdʒ; en-]:vt. 鼓励,怂恿,激励,支持
IV. CONCLUSION
In this paper, an effective method for vehicle color recognition has been proposed. We demonstrate that the BoW representation of local patch features is powerful to describe object colors. The interesting regions of dominant color of a vehicle can be implicitly selected by assigning the weights to each subregion using a classifier. The extensive experiments on both image and video data demonstrate the potential of the proposed method in real applications. Our future work might be integrating the proposed method and mature image segmentation techniques for localizing the interesting color region more accurately.
ACKNOWLEDGMENT
The authors would like to thank the three anonymous reviewers for their valuable comments. The authors also thank the Third Research Institute, Ministry of Public Security, for nicely providing part of the experimental data.
anonymous [ə'nɒnɪməs]:adj. 匿名的,无名的,无个性特征的
Ministry of Public Security of the People's Republic of China,MPS:中华人民共和国公安部
References
Single Image Haze Removal Using Dark Channel Prior
WORDBOOK
signal-to-noise ratio,SNR or S/N
KEY POINTS
As a vehicle has its inner structure, the main challenge of vehicle color recognition is to select the region of interest (ROI) for recognizing its dominant color.
Then, the ROI in vehicle images is selected by assigning the subregions with different weights that are learned by a classifier trained on the vehicle images.
However, all these BoW-based methods focus on scene recognition. They cannot be directly applied to vehicle color recognition because the local feature describes the texture, rather than the color information of a patch.
Since the vehicle has its specific inner structure and different parts may be in different colors, it requires us to recognize the dominant color of a vehicle. For example, we are more interested in the color of vehicle body than other parts such as wheels or windows. Thus, it is very important to select the region of interest (ROI) of a vehicle for color recognition.
Each vehicle in our data set is labeled with its color, brand, bounding box (for training a vehicle detector), and category. The data set can be helpful for others in the various applications of ITS, such as vehicle detection, vehicle color recognition, and vehicle brand recognition.
In order to overcome the influences, we adopt the haze removal method [27] and color contrast method [28] as the preprocessing in our method.
We apply haze removal first in the preprocessing, since the color contrast stretch cannot significantly improve the quality of the images under thick haze. The dominant color of the vehicle image is more obvious after the haze removal algorithm and the color contrast stretch method.
We divide the colors of vehicles into eight classes, including black, white, blue, yellow, green, red, gray, and cyan. Linear SVM is used in our method for color classification.
The image data set contains 15 601 vehicle images of various categories, such as sedan, truck, and bus.
In our experiments, the data set is randomly divided into two groups, i.e., half for training and half for testing.
As shown in Table I, global features work much better than local patch features, including our color histogram. This is reasonable, since our color histogram is a combination of the local patch features without spatial information, whereas color correlogram [20] and layered color indexing [35] are facilitated by the spatial information of different color types.
These results demonstrate that BoW representation brings more discriminative power after transforming the original color feature to a feature space of a higher dimension. The best results are obtained based on the BoW representation of our color histogram, since our combined feature can keep the merits of different features to overcome the influence caused by overexposure and color shift. In addition, different features can be weighted by learning with SVM.
Although color correlogram and layered color indexing also contain the spatial information, they cannot robustly capture the structure of a vehicle.
In our data set, the variances in green and gray are much larger than the others. As these two colors are less unified, their features are more scattered in the feature space and difficult to be classified. Thus, the recognition rates for these two colors are lower than that of the other color types in all the evaluated methods.
PCA is often used for dimension reduction and helps eliminate the noise embedded in the original feature space. CAC is used to combine the appearance information and coordinate of a patch into a feature vector. Due to the constraint of the location, the patches with the same coordinates are assigned in one cluster center. Thus, the features of the subregions of different locations are encoded by the different codewords. The dimension of the proposed color descriptor is reduced from 211 to 100 by PCA in our practice.
the regions of window and background are less considered in the color prediction process, whereas the engine hood tends to be more dominant in color decision. For different categories of vehicles, the structures in the frontal view are similar. Our method can perform successful color recognitions of the different categories under mild structure variances.
For side-view vehicle images, the model trained from the frontal view may not make the correct predictions due to the different structure of the ROI.
With the number of subregions increasing, the precision rises at first and then declines. The smaller subregions make the representation of the image too trivial and sensitive to intraclass variance. The larger regions have good generalization property but poor capability in discrimination. Additionally, the length of the feature vector becomes larger when the number of the subregions increases.
It suggests that the fan-like subregion is more appropriate for vehicle color recognition.
This can be addressed by the fact that the feature extracted from large partitions is not able to capture the local information, thus losing the discriminative power.
As the number of subregions increases, the image becomes overpartitioned, and the discriminative power of the descriptor decreases.
In our experiment, the performance of vehicle color recognition is affected by the vehicle detection results, particularly when the vehicle image is incomplete or contains a large proportion of background. By setting a high threshold in the vehicle detection process, the precision of detection can be increased, thus boosting the performance of color recognition.
We demonstrate that the BoW representation of local patch features is powerful to describe object colors. The interesting regions of dominant color of a vehicle can be implicitly selected by assigning the weights to each subregion using a classifier.
Linear SVM is trained for color recognition of vehicle images. Although nonlinear SVM generally outperforms linear SVM, it takes more time to train a model. We chose the implementation of LibLinear [34] to solve the multiclass classification problem.
The patch features are important as they describe local color information, which affects the performance of our method significantly.