Matplotlib学习笔记1-2D绘图
1、直方图
matplotlib.pyplot.hist(x, bins=10, range=None, normed=False, weights=None, cumulative=False, bottom=None, histtype='bar', align='mid', orientation='vertical', rwidth=None, log=False, color=None, label=None, stacked=False, hold=None, data=None, **kwargs)
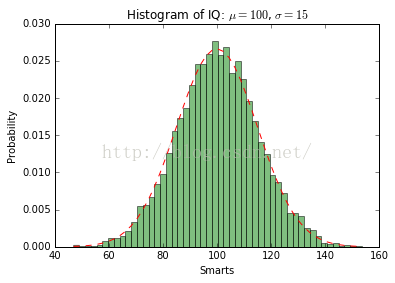
代码示例:
import numpy as np
import matplotlib.mlab as mlab
import matplotlib.pyplot as plt
# example data
mu = 100 # mean of distribution
sigma = 15 # standard deviation of distribution
x = mu + sigma * np.random.randn(10000)
num_bins = 50
# the histogram of the data
n, bins, patches = plt.hist(x, num_bins, normed=1, facecolor='green', alpha=0.5)
# add a 'best fit' line
y = mlab.normpdf(bins, mu, sigma)
plt.plot(bins, y, 'r--')
plt.xlabel('Smarts')
plt.ylabel('Probability')
plt.title(r'Histogram of IQ: $\mu=100$, $\sigma=15$')
# Tweak spacing to prevent clipping of ylabel
plt.subplots_adjust(left=0.15)
plt.show()
结果如下:
函数参数解释:
x,输入数据,可以是一个一维序列,或多个不同长度的一维序列,或一个二维数组(等同于多个等长的一维序列)
bins,分段区间,可以是一个整数或一个序列,如果是整数n,将会均匀分为n个区间,否则按指定的序列进行分段
range,指定横坐标的起始和终止范围,默认范围是(x.min(), x.max()),也可由用户自行指定,如range=(min, max)。另外,如果bins是按指定序列分段,那么range参数设置是无效的
normed,是否直方图归一化,默认为False,如果设为True,将会调整纵坐标的值,使得直方图中每个长方形块的面积之和为1,注意,不是每个长方形块的纵坐标值之和为1
weights,默认为False,统计直方图时将对x中每个样本进行加1计数,如果设为一个与x等长的序列,那么就不再是加1计数,而是权值求和
cumulative,是否累加,默认为False,如果为True,后一个直方图将累加前面的直方图计数
bottom,默认为None,所有长方形块的纵坐标起始值是0,可以设为一个整数或一个序列
orientation ,可设为‘horizontal’或‘vertical’
log,默认为False,如果为True,横坐标将变成对数坐标,即log(x)
color,默认为蓝色,设置颜色直接输入颜色的英文单词即可,如color='red'
以上参数是常用的函数参数,更多的参数可以查阅手册http://matplotlib.org/api/pyplot_api.html
函数返回值:
n,每个长方形块的纵坐标值
bins,每个长方形块的左右横坐标值
patches,Patch objects列表,长度等于n,里面不知道是什么数据
