混淆矩阵(confusion matrix)
git源码地址 https://github.com/xuman-Amy/Model-evaluation-and-Hypamameter-tuning
数据地址 https://archive.ics.uci.edu/ml/datasets/Breast+Cancer+Wisconsin+(Diagnostic)
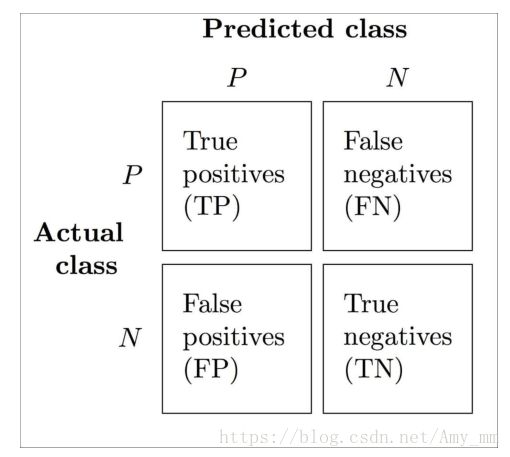
True positive (TP) :真实为P,预测为P
True negative (TN): 真实为N,预测为N
False positive (FP):真实为N,预测为P
False negative (FN):真实为P,预测为N
【sklearn 实现confusion matrix】
from sklearn .metrics import confusion_matrix
pipe_lr.fit(X_train, y_train)
y_pred = pipe_lr.predict(X_test)
conmat = confusion_matrix(y_true = y_test, y_pred = y_pred)
print(conmat)
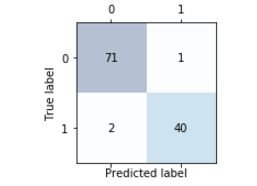
用matshow显示出
# plot confusion matrix
fig, ax = plt.subplots(figsize = (2.5, 2.5))
ax.matshow(confmat, cmap = plt.cm.Blues, alpha = 0.3)
for i in range(confmat.shape[0]):
    for j in range(confmat.shape[1]):
        ax.text(x = j, y = i,          #ax.text()在轴上添加文本
                s = confmat[i, j],
                va = 'center',
                ha = 'center')
plt.xlabel('Predicted label')
plt.ylabel('True label')

plt.tight_layout()
plt.show()
【几个公式】
召回率(Recall ——True Positive Rate):
【sklearn 计算上述公式】
from sklearn.metrics import precision_score, recall_score, f1_score
print('Precision: %.3f' % precision_score(y_true=y_test, y_pred=y_pred))
print('Recall: %.3f' % recall_score(y_true=y_test, y_pred=y_pred))
print('F1: %.3f' % f1_score(y_true=y_test, y_pred=y_pred))
在sklearn中positive是class被标记为1的类即class 1,如果想要将class 0 设为positive,可以用make_scorer函数设置
from sklearn.metrics import make_scorer

scorer = make_scorer(f1_score, pos_label=0)

c_gamma_range = [0.01, 0.1, 1.0, 10.0]

param_grid = [{'svc__C': c_gamma_range,
               'svc__kernel': ['linear']},
              {'svc__C': c_gamma_range,
               'svc__gamma': c_gamma_range,
               'svc__kernel': ['rbf']}]

gs = GridSearchCV(estimator=pipe_svc,
                  param_grid=param_grid,
                  scoring=scorer,
                  cv=10,
                  n_jobs=-1)
gs = gs.fit(X_train, y_train)
print(gs.best_score_)
print(gs.best_params_)
scorer = make_scorer(f1_score, pos_label=0)

c_gamma_range = [0.01, 0.1, 1.0, 10.0]

param_grid = [{'svc__C': c_gamma_range,
               'svc__kernel': ['linear']},
              {'svc__C': c_gamma_range,
               'svc__gamma': c_gamma_range,
               'svc__kernel': ['rbf']}]

gs = GridSearchCV(estimator=pipe_svc,
                  param_grid=param_grid,
                  scoring=scorer,
                  cv=10,
                  n_jobs=-1)
gs = gs.fit(X_train, y_train)
print(gs.best_score_)
print(gs.best_params_)
【Receiver Operating Curve】
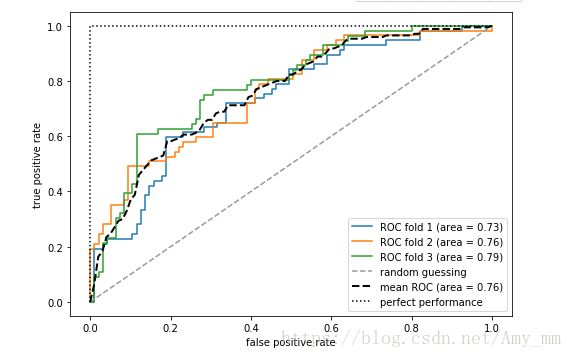
通过评估TPR和FPR 的值来进行模型选择,好的模型应该是TPR趋近于1,FPR趋近于0.即在ROC的左上方。
【 ROC Area Under the Curve (ROC AUC)】
# ROC curve
from sklearn.metrics import roc_curve, auc
from scipy import interp

# LR pipeline
pipe_lr = make_pipeline(StandardScaler(),
                        PCA(n_components=2),
                        LogisticRegression(penalty='l2',
                                           random_state=1,
                                           C=100.0))

X_train2 = X_train[:, [4, 14]]


cv = list(StratifiedKFold(n_splits=3,
                          random_state=1).split(X_train, y_train))

fig = plt.figure(figsize=(7, 5))

mean_tpr = 0.0
mean_fpr = np.linspace(0, 1, 100)
all_tpr = []

for i, (train, test) in enumerate(cv):
    probas = pipe_lr.fit(X_train2[train],
                         y_train[train]).predict_proba(X_train2[test])

    fpr, tpr, thresholds = roc_curve(y_train[test],
                                     probas[:, 1],
                                     pos_label=1)
    mean_tpr += interp(mean_fpr, fpr, tpr)
    mean_tpr[0] = 0.0
    roc_auc = auc(fpr, tpr)
    plt.plot(fpr,
             tpr,
             label='ROC fold %d (area = %0.2f)'
                   % (i+1, roc_auc))

plt.plot([0, 1],
         [0, 1],
         linestyle='--',
         color=(0.6, 0.6, 0.6),
         label='random guessing')

mean_tpr /= len(cv)
mean_tpr[-1] = 1.0
mean_auc = auc(mean_fpr, mean_tpr)
plt.plot(mean_fpr, mean_tpr, 'k--',
         label='mean ROC (area = %0.2f)' % mean_auc, lw=2)
plt.plot([0, 0, 1],
         [0, 1, 1],
         linestyle=':',
         color='black',
         label='perfect performance')

plt.xlim([-0.05, 1.05])
plt.ylim([-0.05, 1.05])
plt.xlabel('false positive rate')
plt.ylabel('true positive rate')
plt.legend(loc="lower right")

plt.tight_layout()
# plt.savefig('images/06_10.png', dpi=300)
plt.show()


