评分卡模型开发--总体流程
一、信用风险评级模型的类型
信用风险计量体系包括主体评级模型和债项评级两部分。主体评级和债项评级均有一系列评级模型组成,其中主体评级模型可用“四张卡”来表示,分别是A卡、B卡、C卡和F卡;债项评级模型通常按照主体的融资用途,分为企业融资模型、现金流融资模型和项目融资模型等。
A卡,又称为申请者评级模型,主要应用于相关融资类业务中新用户的主体评级,适用于个人和机构融资主体。
B卡,又称为行为评级模型,主要应用于相关融资类业务中存量客户在续存期内的管理,如对客户可能出现的逾期、延期等行为进行预测,仅适用于个人融资主体。
C卡,又称为催收评级模型,主要应用于相关融资类业务中存量客户是否需要催收的预测管理,仅适用于个人融资主体。
F卡,又称为欺诈评级模型,主要应用于相关融资类业务中新客户可能存在的欺诈行为的预测管理,适用于个人和机构融资主体。
我们主要讨论主体评级模型的开发过程。
二、信用风险评级模型开发流程概述
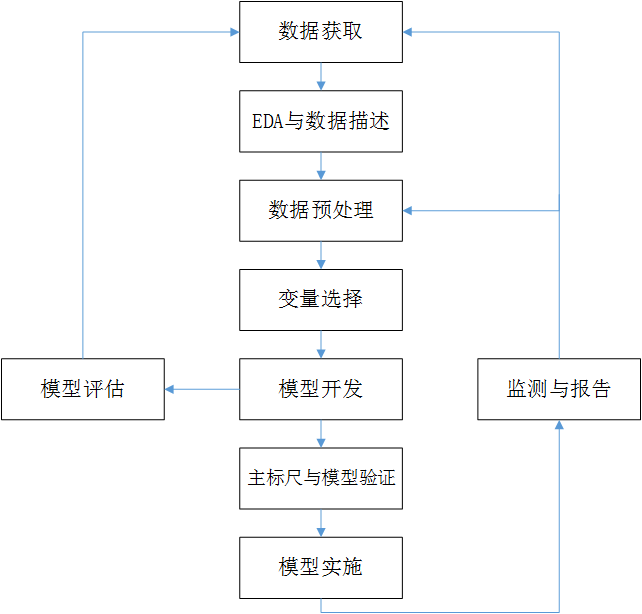
典型的评级模型开发流程如图2.1所示。该流程中各个步骤的顺序可根据具体情况的不同进行适当调整,也可以根据需要重复某些步骤。
信用风险评级模型的主要开发流程如下:
(1) 数据获取,包括获取存量客户及潜在客户的数据。存量客户是指已经在证券公司开展相关融资类业务的客户,包括个人客户和机构客户;潜在客户是指未来拟在证券公司开展相关融资类业务的客户,主要包括机构客户,这也是解决证券业样本较少的常用方法,这些潜在机构客户包括上市公司、公开发行债券的发债主体、新三板上市公司、区域股权交易中心挂牌公司、非标融资机构等。
(2) EDA(探索性数据分析)与数据描述,该步骤主要是获取样本总体的大概情况,以便制定样本总体的数据预处理方法。描述样本总体情况的指标主要有缺失值情况、异常值情况、平均值、中位数、最大值、最小值、分布情况等。
(3) 数据预处理,主要工作包括数据清洗、缺失值处理、异常值处理,主要是为了将获取的原始数据转化为可用作模型开发的格式化数据。
(4) 变量选择,该步骤主要是通过统计学的方法,筛选出对违约状态影响最显著的指标。
(5) 模型开发,该步骤主要包括变量分段、变量的WOE(证据权重)变换和逻辑回归估算三部分。
(6) 主标尺与模型验证,该步骤主要是开发某类主体的主标尺并进行模型的验证与校准。
(7) 模型评估,该步骤主要是根据模型验证和主标尺设计的结果,评估模型的区分能力、预测能力、稳定性,并形成模型评估报告,得出模型是否可以使用的结论。
(8) 模型实施,即模型的部署和应用。
(9) 监测与报告,该步骤主要工作是定期检测模型的使用情况,并关注和定期检验模型的区分能力与预测能力的变化及模型稳定性的变化,在出现模型可能不能满足业务需求的情况时,反馈至模型开发团队,及时进行模型更新或重新开发。
三、基于Logistic回归的标准评分卡模型开发实现
3.1 明确要解决的问题
在开发信用风险评级模型(包括个人和机构)之前,首先要明确我们需要解决的问题。因为,个人信用风险评级模型包括申请者评级、行为评级、催收评级、欺诈评级等几类,开发每一类评级模型所需要的数据也是不同的,例如开发个人申请者评级模型需要的是个人客户申请融资类业务时提交的数据,开发个人行为评级模型需要的是存量个人客户的历史行为数据,这两部分数据及需要解决的问题,也存在较大的差异。因此,在开发信用风险评级模型之前,我们需要明确开发模型的类型。此处以开发个人客户的申请者评级模型为例,来详细讲述此类模型的开发过程。
开发申请者评分模型所需要的数据是个人客户申请融资类业务时所需的数据,包括反映个人还款意愿的定性数据,应用申请者评分模型的目的是预测该申请客户在未来一段时间发生违约的概率。
我们做预测模型的一个基本原理是用历史数据来预测未来,申请者评分模型需要解决的问题是未来一段时间(如12个月)融资人出现违约(如至少一次90天或90天以上逾期)的概率。在这个需求中,“未来一段时间”为表现时间窗口(performance window),“融资人出现至少一次90天或90天以上逾期”为观察时间窗口(sample window)。个人主体的违约跟个人行为习惯有很大的相关性,因此我们可以通过分析个人样本总体中客户的历史我违约频率来确定表现时间窗口和观察时间窗口。这两个窗口的确定对于我们要解决的问题,有着非常重要的影响,我们将放在第二步中结合具体的数据来分析,并讲述具体的确定方法。
3.2 数据描述和探索性数据分析
数据准备和数据预处理是整个信用风险模型开发过程中最重要也是最耗时的工作了。通常情况下,数据准备和数据预处理阶段消耗的时间占整个模型开发时间的80%以上,该阶段主要的工作包括数据获取、探索性数据分析、缺失值处理、数据校准、数据抽样、数据转换,还包括离散变量的降维、连续变量的优先分段等工作。
明确了要解决的问题后,接下来我们就要搜集相关的数据了。此处,我们以互联网上经常被用来研究信用风险评级模型的加州大学机器学习数据库中的german credit data为例,来详细讲述个人客户信用风险评级模型的开发方法。
German credit data 的数据来自”klaR”包
install.packages(“klaR”)
library(“klaR”)
data(GermanCredit)
View(GermanCredit)      #查看该数据集
- 1
- 2
- 3
- 4
- 5
该数据集包含了1000个样本,每个样本包括了21个变量(属性),其中包括1个违约状态变量“credit_risk”,剩余20个变量包括了所有的定量和定性指标,分别如表3.1所示。
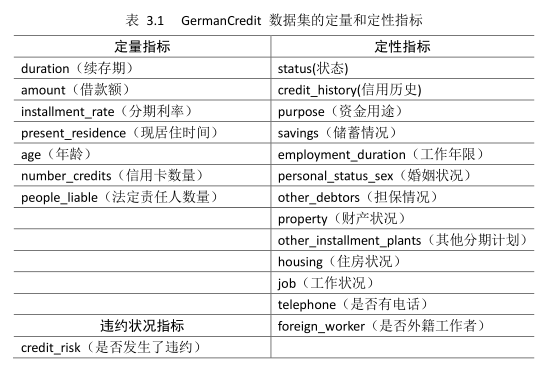
接下来,我们需要检查数据的质量,主要包括缺失值情况、异常值情况及其他处理方法。缺失值和异常值处理的基本原则是处理前后的分布总体保持一致。
3.21 用户数据的缺失值处理:
http://blog.csdn.net/lll1528238733/article/details/76599626
3.22 用户数据的异常值处理:
http://blog.csdn.net/lll1528238733/article/details/76599792
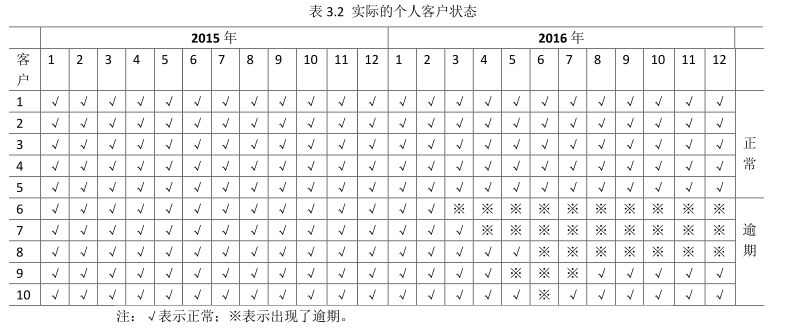
需要特别说明的是,在实际的样本搜集和数据预处理中,我们应该首先对个人客户的违约做出定义,并根据对违约的定义对搜集的样本进行必要的校准。一般情况下,我们搜集的数据为非标准化的数据,如表3.2所示,该表中假设搜集的是前10个客户在两年内的历史违约情况。
在表3.2所示的数据集中,如果我们假设连续出现三个月逾期可被定义为违约,则客户6至客户9可被确认为违约。然而,为了明确违约的概念,我们还需要确定基准时间和观察时间窗口。如果当前时间是2016年7月末,则只有6和7两个客户为违约,其他客户均属于正常客户,如果当前时间是2016年9月末,则只有6、7、8三个客户为违约,客户9已经自愈,则再次变成正常客户。
结合上述分析,在明确评分卡要解决的实际问题时,还应该确定表现时间窗口和观察时间窗口,而这两个窗口的确定,需要根据我们搜集的数据来具体确定。他们的确定方法,分别如下:
在确定变现时间窗口的长度时,我们通常需要客户从开始开立融资类业务时到最近时间点(或至少两年以上的历史逾期情况)的逾期表现,用图形表示,如图3.7所示。
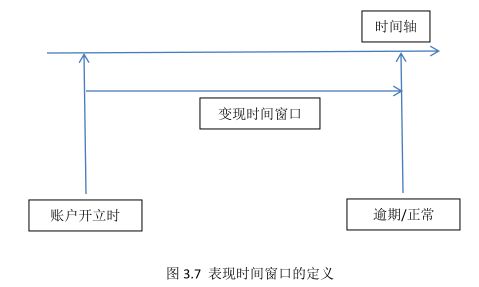
按照图3.7所示的表现时间窗口的定义方法,我们对样本总体进行统计分析,以逾期90天定义为违约,会得出表3.3所示的统计结果。
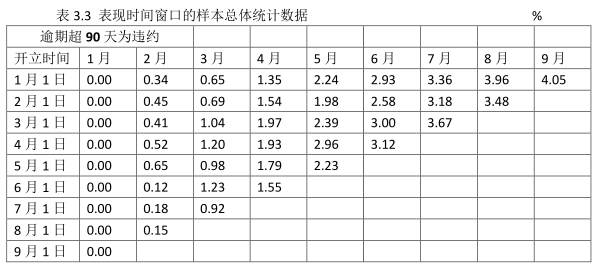
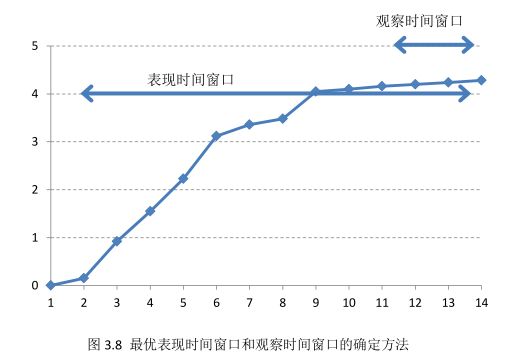
表3.3中8月最后一列数据3.48%表示,2.1日开立的所有账户中,8个月后出现逾期90天以上的账户占样本的比重为3.48%。我们通过这样统计方法,并绘制样本总体的违约状态变化曲线,即可得到如图3.8所示的曲线。从图3.8所示的曲线中我们可以看出,在账户开立第11个月到第13个月时,客户的违约状态达到稳定状态,曲线变得非常平稳。此时,我们可以确定评分卡的表现时间窗口为11个月到13个月,即我们将违约状态变得稳定的时间段确定为表现时间窗口。这种方法可使我们开发的评分卡模型的区分能力和预测能力准确性均达到最优稳定状态。
由图3.8的曲线可以看出,客户开立融资类业务的账户的起始阶段发生违约的频率是不断增多的,但随着时间的推移发生违约的客户的占比处于稳定状态。那么,我们在开发信用风险评分卡模型时,需要选择客户违约处于稳定状态的时间点来作为最优表现时间窗口,这样既可以最大限度地降低模型的不稳定性,也可以避免低估最终的违约样本的比率。例如,当我们选择表现时间窗口为6个月时,样本总体中的违约样本占比仅为3%左右,而实际违约样本占比约为4.5%。
上例中,观察时间窗口我们确定为90天,当然也可以是60天或30天,但当观察时间窗口确定为30天时,客户的违约状态将会更快地达到稳定状态。如果我们按照某个监管协议(如巴塞尔协议)的要求开发信用风险评分卡模型,则观察时间窗口也要按照监管协议的要求确定。除此之外,观察时间窗口的确定要根据样本总体和证券公司的风险偏好综合考虑确定。但在个人信用风险评级模型开发领域,大多数将逾期90天及以上定义为个人客户的违约状态。
以上讲的都是开发申请者评分卡模型时表现时间窗口的确定方法,在开发个人客户的行为评分卡和催收评分卡模型时,表现时间窗口的确定方法也算是类似的。但开发这两类模型时,表现时间窗口的长度却跟申请者评分模型有较大不同,如催收评分卡模型的表现时间窗口通常设定为2周,甚至更短的时间。因为实际业务开展过程中,通常客户逾期超过2周,就要启动催收程序了。
个人客户的信用风险评级模型开发进行至此时,我们已经得到了没有缺失值和异常值的样本总体,违约的定义确定了,表现时间窗口和观察时间窗口也确定了。接下来,我们将进入评分卡模型开发的第三步数据集准备阶段了。
3.3 数据集准备
在缺失值和处理完成后,我们就得到了可用作信用风险评级模型开发的样本总体。通常为了验证评级模型的区分能力和预测准确性,我们需要将样本总体分为样本集和测试集,这种分类方法被称为样本抽样。常用的样本抽样方法包括简单随机抽样、分层抽样和整群抽样三种。
数据集准备:
http://blog.csdn.net/lll1528238733/article/details/76599861
3.4 变量筛选
模型开发的前三步主要讲的是数据处理的方法,从第四步开始我们将逐步讲述模型开发的方法。在进行模型开发时,并非我们收集的每个指标都会用作模型开发,而是需要从收集的所有指标中筛选出对违约状态影响最大的指标,作为入模指标来开发模型。接下来,我们将分别介绍定量指标和定性指标的筛选方法。
3.41 定量指标的筛选方法
http://blog.csdn.net/lll1528238733/article/details/76600019
3.42 定性指标的筛选方法
http://blog.csdn.net/lll1528238733/article/details/76600147
3.5 WOE值计算
对入模的定量和定性指标,分别进行连续变量分段(对定量指标进行分段),以便于计算定量指标的WOE和对离散变量进行必要的降维。对连续变量的分段方法通常分为等距分段和最优分段两种方法。等距分段是指将连续变量分为等距离的若干区间,然后在分别计算每个区间的WOE值。最优分段是指根据变量的分布属性,并结合该变量对违约状态变量预测能力的变化,按照一定的规则将属性接近的数值聚在一起,形成距离不相等的若干区间,最终得到对违约状态变量预测能力最强的最优分段。
我们首先选择对连续变量进行最优分段,在连续变量的分布不满足最优分段的要求时,在考虑对连续变量进行等距分段。此处,我们讲述的连续变量最优分段算法是基于条件推理树(conditional inference trees, Ctree)的递归分割算法,其基本原理是根据自变量的连续分布与因变量的二元分布之间的关系,采用递归的回归分析方法,逐层递归满足给定的显著性水平,此时获取的分段结果(位于Ctree的叶节点上)即为连续变量的最优分段。其核心算法用函数ctree()表示。
评分卡模型开发-WOE值计算:
http://blog.csdn.net/lll1528238733/article/details/76600598
3.6 基于逻辑回归的标准评分卡实现
由逻辑回归的基本原理,我们将客户违约的概率表示为p,则正常的概率为1-p。因此,可以得到:

此时,客户违约的概率p可表示为:

评分卡设定的分值刻度可以通过将分值表示为比率对数的线性表达式来定义,即可表示为下式:
![]()
其中,A和B是常数。式中的负号可以使得违约概率越低,得分越高。通常情况下,这是分值的理想变动方向,即高分值代表低风险,低分值代表高风险。
逻辑回归模型计算比率如下所示:
![]()
其中,用建模参数拟合模型可以得到模型参数β0,β1,…,βn。β0,β1,…,βn。为二元变量,表示变量i是否取第j个值。上式可重新表示为:

此式即为最终评分卡公式。如果x1…xnx1…xn的第j行的分值取决于以下三个数值:

(1)刻度因子B;
(2)逻辑回归方程的参数βiβi
综上,我们详细讲述了模型开发及生成标准评分卡各步骤的处理结果,自动生成标准评分卡的R完整代码:
library(klaR)
library(InformationValue)
data(GermanCredit)
train_kfold<-sample(nrow(GermanCredit),800,replace = F)
train_kfolddata<-GermanCredit[train_kfold,]   #提取样本数据集
test_kfolddata<-GermanCredit[-train_kfold,]   #提取测试数据集
credit_risk<-ifelse(train_kfolddata[,"credit_risk"]=="good",0,1)
#将违约样本用“1”表示,正常样本用“0”表示。
tmp<-train_kfolddata[,-21]
data<-cbind(tmp,credit_risk)
quant_vars<-c("duration","amount","installment_rate","present_residence","age",
              "number_credits","people_liable","credit_risk")
             #获取定量指标
quant_GermanCredit<-data[,quant_vars]  #提取定量指标

#逐步回归法,获取自变量中对违约状态影响最显著的指标
base.mod<-lm(credit_risk~1,data = quant_GermanCredit)
#获取线性回归模型的截距
all.mod<-lm(credit_risk~.,data = quant_GermanCredit)
#获取完整的线性回归模型
stepMod<-step(base.mod,scope = list(lower=base.mod,upper=all.mod),
              direction = "both",trace = 0,steps = 1000)
#采用双向逐步回归法,筛选变量
shortlistedVars<-names(unlist(stepMod[[1]]))
#获取逐步回归得到的变量列表
shortlistedVars<-shortlistedVars[!shortlistedVars %in%"(Intercept)"]
#删除逐步回归的截距
print(shortlistedVars)
#输出逐步回归后得到的变量
quant_model_vars<-c("duration","amount","installment_rate","age")
#完成定量入模指标
#提取数据集中全部的定性指标
factor_vars<-c("status","credit_history","purpose","savings","employment_duration",
               "personal_status_sex","other_debtors","property",
               "other_installment_plans","housing","job","telephone","foreign_worker")
               #获取所有名义变量
all_iv<-data.frame(VARS=factor_vars,IV=numeric(length(factor_vars)),
                   STRENGTH=character(length(factor_vars)),stringsAsFactors = F)
                  #初始化待输出的数据框
for(factor_var in factor_vars)
{
  all_iv[all_iv$VARS==factor_var,"IV"]<-InformationValue::IV(X=
  data[,factor_var],Y=data$credit_risk)
  #计算每个指标的IV值
  all_iv[all_iv$VARS==factor_var,"STRENGTH"]<-attr(InformationValue::IV(X=
  data[,factor_var],Y=data$credit_risk),"howgood")
  #提取每个IV指标的描述
}
all_iv<-all_iv[order(-all_iv$IV),]    #排序IV
qual_model_vars<-subset(all_iv,STRENGTH=="Highly Predictive")[1:5,]
qual_model_vars<-c("status","credit_history","savings","purpose","property")

#连续变量分段和离散变量降维
#1.变量duration
library(smbinning)
result<-smbinning(df=data,y="credit_risk",x="duration",p=0.05)
result$ivtable

duration_Cutpoint<-c()
duration_WoE<-c()
duration<-data[,"duration"]
for(i in 1:length(duration))
{
  if(duration[i]<=8)
  {
    duration_Cutpoint[i]<-"<= 8"
    duration_WoE[i]<--1.5670
  }
  if(duration[i]<=33&duration[i]>8)
  {
    duration_Cutpoint[i]<-"<= 33"
    duration_WoE[i]<--0.0924
  }
  if(duration[i]> 33)
  {
    duration_Cutpoint[i]<-"> 33"
    duration_WoE[i]<-0.7863
  }
}
#2.变量amount
result<-smbinning(df=data,y="credit_risk",x="amount",p=0.05)
result$ivtable
amount_Cutpoint<-c()
amount_WoE<-c()
amount<-data[,"amount"]
for(i in 1:length(amount))
{
  if(amount[i]<= 3913)
  {
    amount_Cutpoint[i]<-"<= 3913"
    amount_WoE[i]<--0.2536
  }
  if(amount[i]<= 9283&amount[i]> 3913)
  {
    amount_Cutpoint[i]<-"<= 9283"
    amount_WoE[i]<-0.4477
  }
  if(amount[i]> 9283)
  {
    amount_Cutpoint[i]<-"> 9283"
    amount_WoE[i]<-1.3109
  }
}
#3.变量age
result<-smbinning(df=data,y="credit_risk",x="age",p=0.05)
result$ivtable
age_Cutpoint<-c()
age_WoE<-c()
age<-data[,"age"]
for(i in 1:length(age))
{
  if(age[i]<= 34)
  {
    age_Cutpoint[i]<-"<= 34"
    age_WoE[i]<-0.2279
  }
  if(age[i] > 34)
  {
    age_Cutpoint[i]<-" > 34"
    age_WoE[i]<--0.3059
  }
}
#4.变量installment_rate等距分段
install_data<-data[,c("installment_rate","credit_risk")]
tb1<-table(install_data)
total<-list()
for(i in 1:nrow(tb1))
{
  total[i]<-sum(tb1[i,])
}
t.tb1<-cbind(tb1,total)
goodrate<-as.numeric(t.tb1[,"0"])/as.numeric(t.tb1[,"total"])
badrate<-as.numeric(t.tb1[,"1"])/as.numeric(t.tb1[,"total"])
gb.tbl<-cbind(t.tb1,goodrate,badrate)
Odds<-goodrate/badrate
LnOdds<-log(Odds)
tt.tb1<-cbind(gb.tbl,Odds,LnOdds)
WoE<-log((as.numeric(tt.tb1[,"0"])/700)/(as.numeric(tt.tb1[,"1"])/300))
all.tb1<-cbind(tt.tb1,WoE)
all.tb1
installment_rate_Cutpoint<-c()
installment_rate_WoE<-c()
installment_rate<-data[,"installment_rate"]
for(i in 1:length(installment_rate))
{
  if(installment_rate[i]==1)
  {
    installment_rate_Cutpoint[i]<-"=1"
    installment_rate_WoE[i]<-0.06252036
  }
  if(installment_rate[i]==2)
  {
    installment_rate_Cutpoint[i]<-"=2"
    installment_rate_WoE[i]<-0.1459539
  }
  if(installment_rate[i]==3)
  {
    installment_rate_Cutpoint[i]<-"=3"
    installment_rate_WoE[i]<--0.03937517
  }
  if(installment_rate[i]==4)
  {
    installment_rate_Cutpoint[i]<-"=4"
    installment_rate_WoE[i]<--0.1657562
  }
}
#定性指标的降维和WoE
discrete_data<-data[,c("status","credit_history","savings","purpose",
                       "property","credit_risk")]
summary(discrete_data)
#对purpose指标进行降维
x<-discrete_data[,c("purpose","credit_risk")]
d<-as.matrix(x)
for(i in 1:nrow(d))
{
  #合并car(new)、car(used)
  if(as.character(d[i,"purpose"])=="car (new)")
  {
    d[i,"purpose"]<-as.character("car(new/used)")
  }
  if(as.character(d[i,"purpose"])=="car (used)")
  {
    d[i,"purpose"]<-as.character("car(new/used)")
  }
  #合并radio/television、furniture/equipment
  if(as.character(d[i,"purpose"])=="radio/television")
  {
    d[i,"purpose"]<-as.character("radio/television/furniture/equipment")
  }
  if(as.character(d[i,"purpose"])=="furniture/equipment")
  {
    d[i,"purpose"]<-as.character("radio/television/furniture/equipment")
  }
  #合并others、repairs、business
  if(as.character(d[i,"purpose"])=="others")
  {
    d[i,"purpose"]<-as.character("others/repairs/business")
  }
  if(as.character(d[i,"purpose"])=="repairs")
  {
    d[i,"purpose"]<-as.character("others/repairs/business")
  }
  if(as.character(d[i,"purpose"])=="business")
  {
    d[i,"purpose"]<-as.character("others/repairs/business")
  }
  #合并retraining、education
  if(as.character(d[i,"purpose"])=="retraining")
  {
    d[i,"purpose"]<-as.character("retraining/education")
  }
  if(as.character(d[i,"purpose"])=="education")
  {
    d[i,"purpose"]<-as.character("retraining/education")
  }
}

new_data<-cbind(discrete_data[,c(-4,-6)],d)
#替换原数据集中的“purpose”指标的值
woemodel<-woe(credit_risk~.,data = new_data,zeroadj=0.5,applyontrain=TRUE)
woemodel$woe
#1.status
status<-as.matrix(new_data[,"status"])
colnames(status)<-"status"
status_WoE<-c()
for(i in 1:length(status))
{
  if(status[i]=="... < 100 DM")
  {
    status_WoE[i]<--0.8671300
  }
  if(status[i]=="0 <= ... < 200 DM")
  {
    status_WoE[i]<--0.4240681
  }
  if(status[i]=="... >= 200 DM / salary for at least 1 year")
  {
    status_WoE[i]<-0.4129033
  }
  if(status[i]=="no checking account")
  {
    status_WoE[i]<-1.2237524
  }
}
#2.credit_history
credit_history<-as.matrix(new_data[,"credit_history"])
colnames(credit_history)<-"credit_history"
credit_history_WoE<-c()
for(i in 1:length(credit_history))
{
  if(credit_history[i]=="no credits taken/all credits paid back duly")
  {
    credit_history_WoE[i]<--1.53771824
  }
  if(credit_history[i]=="all credits at this bank paid back duly")
  {
    credit_history_WoE[i]<--1.00079000
  }
  if(credit_history[i]=="existing credits paid back duly till now")
  {
    credit_history_WoE[i]<--0.09646414
  }
  if(credit_history[i]=="delay in paying off in the past")
  {
    credit_history_WoE[i]<--0.01996074
  }
  if(credit_history[i]=="critical account/other credits existing")
  {
    credit_history_WoE[i]<-0.77276102
  }
}
#3.savings
savings<-as.matrix(new_data[,"savings"])
colnames(savings)<-"savings"
savings_WoE<-c()
for(i in 1:length(savings))
{
  if(savings[i]=="... < 100 DM")
  {
    savings_WoE[i]<--0.3051490
  }
  if(savings[i]=="100 <= ... < 500 DM")
  {
    savings_WoE[i]<--0.2267733
  }
  if(savings[i]=="500 <= ... < 1000 DM")
  {
    savings_WoE[i]<-0.8340112
  }
  if(savings[i]=="... >= 1000 DM")
  {
    savings_WoE[i]<-1.1739617
  }
  if(savings[i]=="unknown/no savings account")
  {
    savings_WoE[i]<-0.7938144
  }
}
#4.property
property<-as.matrix(new_data[,"property"])
colnames(property)<-"property"
property_WoE<-c()
for(i in 1:length(property))
{
  if(property[i]=="real estate")
  {
    property_WoE[i]<-0.49346566
  }
  if(property[i]=="building society savings agreement/life insurance")
  {
    property_WoE[i]<--0.16507975
  }
  if(property[i]=="car or other")
  {
    property_WoE[i]<-0.08054425
  }
  if(property[i]=="unknown/no property")
  {
    property_WoE[i]<--0.65586969
  }
}
#5.purpose
purpose<-as.matrix(new_data[,"purpose"])
colnames(purpose)<-"purpose"
purpose_WoE<-c()
for(i in 1:length(purpose))
{
  if(purpose[i]=="car(new/used)")
  {
    purpose_WoE[i]<--0.11260594
  }
  if(purpose[i]=="domestic appliances")
  {
    purpose_WoE[i]<-0.53602528
  }
  if(purpose[i]=="others/repairs/business")
  {
    purpose_WoE[i]<--0.09146793
  }
  if(purpose[i]=="radio/television/furniture/equipment")
  {
    purpose_WoE[i]<--0.23035114
  }
  if(purpose[i]=="retraining/education")
  {
    purpose_WoE[i]<--0.43547619
  }
}
#入模定量和定性指标
model_data<-cbind(data[,quant_model_vars],data[,qual_model_vars])
#入模定量和定性指标的WOE
credit_risk<-as.matrix(data[,"credit_risk"])
colnames(credit_risk)<-"credit_risk"
model_data_WOE<-as.data.frame(cbind(duration_WoE,amount_WoE,age_WoE,
                installment_rate_WoE,status_WoE,credit_history_WoE,
                savings_WoE,property_WoE,purpose_WoE,credit_risk))
#入模定量和定性指标“分段”
model_data_Cutpoint<-cbind(duration_Cutpoint,amount_Cutpoint,age_Cutpoint,
                     installment_rate_Cutpoint,status,credit_history,
                     savings,property,purpose)
#逻辑回归
m<-glm(credit_risk~.,data=model_data_WOE,family = binomial())
alpha_beta<-function(basepoints,baseodds,pdo)
{
  beta<-pdo/log(2)
  alpha<-basepoints+beta*log(baseodds)
  return(list(alpha=alpha,beta=beta))
}
coefficients<-m$coefficients
#通过指定特定比率(1/20)的特定分值(50)和比率翻番的分数(10),来计算评分卡的系数alpha和beta
x<-alpha_beta(50,0.05,10)
#计算基础分值
basepoint<-round(x$alpha-x$beta*coefficients[1])
#1.duration_score
duration_score<-round(as.matrix(-(model_data_WOE[,"duration_WoE"]*
                                    coefficients["duration_WoE"]*x$beta)))
colnames(duration_score)<-"duration_score"
#2.amount_score
amount_score<-round(as.matrix(-(model_data_WOE[,"amount_WoE"]*
                                  coefficients["amount_WoE"]*x$beta)))
colnames(amount_score)<-"amount_score"
#3.age_score
age_score<-round(as.matrix(-(model_data_WOE[,"age_WoE"]*
                                  coefficients["age_WoE"]*x$beta)))
colnames(age_score)<-"age_score"
#4.installment_rate_score
installment_rate_score<-round(as.matrix(-(model_data_WOE[,"installment_rate_WoE"]*
                                  coefficients["installment_rate_WoE"]*x$beta)))
colnames(installment_rate_score)<-"installment_rate_score"
#5.status_score
status_score<-round(as.matrix(-(model_data_WOE[,"status_WoE"]*
                               coefficients["status_WoE"]*x$beta)))
colnames(status_score)<-"status_score"
#6.credit_history_score
credit_history_score<-round(as.matrix(-(model_data_WOE[,"credit_history_WoE"]*
                                  coefficients["credit_history_WoE"]*x$beta)))
colnames(credit_history_score)<-"credit_history_score"
#7.savings_score
savings_score<-round(as.matrix(-(model_data_WOE[,"savings_WoE"]*
                                          coefficients["savings_WoE"]*x$beta)))
colnames(savings_score)<-"savings_score"
#8.property_score
property_score<-round(as.matrix(-(model_data_WOE[,"property_WoE"]*
                                   coefficients["property_WoE"]*x$beta)))
colnames(property_score)<-"property_score"
#9.purpose_score
purpose_score<-round(as.matrix(-(model_data_WOE[,"purpose_WoE"]*
                                    coefficients["purpose_WoE"]*x$beta)))
colnames(purpose_score)<-"purpose_score"
#输出最终的CSV格式的打分卡
#1.基础分值
r1<-c("","basepoint",20)
m1<-matrix(r1,nrow = 1)
colnames(m1)<-c("Basepoint","Basepoint","Score")
#2.duration的分值
duration_scoreCard<-cbind(as.matrix(c("Duration","",""),ncol=1),
                    unique(cbind(duration_Cutpoint,duration_score)))
#View(duration_scoreCard)
#3.amount的分值
amount_scoreCard<-cbind(as.matrix(c("Amount","",""),ncol=1),
                          unique(cbind(amount_Cutpoint,amount_score)))
#View(amount_scoreCard)
#4.age的分值
age_scoreCard<-cbind(as.matrix(c("Age",""),ncol=1),
                        unique(cbind(age_Cutpoint,age_score)))
#View(age_scoreCard)
#5.installment_rate的分值
installment_rate_scoreCard<-cbind(as.matrix(c("Installment_rate","","",""),ncol=1),
                     unique(cbind(installment_rate_Cutpoint,installment_rate_score)))
#View(installment_rate_scoreCard)
#6.status的分值
status_scoreCard<-cbind(as.matrix(c("Status","","",""),ncol=1),
                                  unique(cbind(status,status_score)))
#View(status_scoreCard)
#7.credit_history的分值
credit_history_scoreCard<-cbind(as.matrix(c("Credit_history","","","",""),ncol=1),
                        unique(cbind(credit_history,credit_history_score)))
#View(credit_history_scoreCard)
#8.savings的分值
savings_scoreCard<-cbind(as.matrix(c("Savings","","","",""),ncol=1),
                                unique(cbind(savings,savings_score)))
#View(savings_scoreCard)
#9.property的分值
property_scoreCard<-cbind(as.matrix(c("Property","","",""),ncol=1),
                         unique(cbind(property,property_score)))
#View(property_scoreCard)
#10.purpose的分值
purpose_scoreCard<-cbind(as.matrix(c("Purpose","","","",""),ncol=1),
                          unique(cbind(purpose,purpose_score)))
#View(purpose_scoreCard)
scoreCard_CSV<-rbind(m1,duration_scoreCard,amount_scoreCard,age_scoreCard,
                     installment_rate_scoreCard,status_scoreCard,credit_history_scoreCard,
                     savings_scoreCard,property_scoreCard,purpose_scoreCard)
#将标准评分卡输出到项目文件中,且命名为ScoreCard.CSV,调整格式即可得到标准评分卡
write.csv(scoreCard_CSV,"C:/Users/ZL/Desktop/creditcard_model/ScoreCard.CSV")
- 1
- 2
- 3
- 4
- 5
- 6
- 7
- 8
- 9
- 10
- 11
- 12
- 13
- 14
- 15
- 16
- 17
- 18
- 19
- 20
- 21
- 22
- 23
- 24
- 25
- 26
- 27
- 28
- 29
- 30
- 31
- 32
- 33
- 34
- 35
- 36
- 37
- 38
- 39
- 40
- 41
- 42
- 43
- 44
- 45
- 46
- 47
- 48
- 49
- 50
- 51
- 52
- 53
- 54
- 55
- 56
- 57
- 58
- 59
- 60
- 61
- 62
- 63
- 64
- 65
- 66
- 67
- 68
- 69
- 70
- 71
- 72
- 73
- 74
- 75
- 76
- 77
- 78
- 79
- 80
- 81
- 82
- 83
- 84
- 85
- 86
- 87
- 88
- 89
- 90
- 91
- 92
- 93
- 94
- 95
- 96
- 97
- 98
- 99
- 100
- 101
- 102
- 103
- 104
- 105
- 106
- 107
- 108
- 109
- 110
- 111
- 112
- 113
- 114
- 115
- 116
- 117
- 118
- 119
- 120
- 121
- 122
- 123
- 124
- 125
- 126
- 127
- 128
- 129
- 130
- 131
- 132
- 133
- 134
- 135
- 136
- 137
- 138
- 139
- 140
- 141
- 142
- 143
- 144
- 145
- 146
- 147
- 148
- 149
- 150
- 151
- 152
- 153
- 154
- 155
- 156
- 157
- 158
- 159
- 160
- 161
- 162
- 163
- 164
- 165
- 166
- 167
- 168
- 169
- 170
- 171
- 172
- 173
- 174
- 175
- 176
- 177
- 178
- 179
- 180
- 181
- 182
- 183
- 184
- 185
- 186
- 187
- 188
- 189
- 190
- 191
- 192
- 193
- 194
- 195
- 196
- 197
- 198
- 199
- 200
- 201
- 202
- 203
- 204
- 205
- 206
- 207
- 208
- 209
- 210
- 211
- 212
- 213
- 214
- 215
- 216
- 217
- 218
- 219
- 220
- 221
- 222
- 223
- 224
- 225
- 226
- 227
- 228
- 229
- 230
- 231
- 232
- 233
- 234
- 235
- 236
- 237
- 238
- 239
- 240
- 241
- 242
- 243
- 244
- 245
- 246
- 247
- 248
- 249
- 250
- 251
- 252
- 253
- 254
- 255
- 256
- 257
- 258
- 259
- 260
- 261
- 262
- 263
- 264
- 265
- 266
- 267
- 268
- 269
- 270
- 271
- 272
- 273
- 274
- 275
- 276
- 277
- 278
- 279
- 280
- 281
- 282
- 283
- 284
- 285
- 286
- 287
- 288
- 289
- 290
- 291
- 292
- 293
- 294
- 295
- 296
- 297
- 298
- 299
- 300
- 301
- 302
- 303
- 304
- 305
- 306
- 307
- 308
- 309
- 310
- 311
- 312
- 313
- 314
- 315
- 316
- 317
- 318
- 319
- 320
- 321
- 322
- 323
- 324
- 325
- 326
- 327
- 328
- 329
- 330
- 331
- 332
- 333
- 334
- 335
- 336
- 337
- 338
- 339
- 340
- 341
- 342
- 343
- 344
- 345
- 346
- 347
- 348
- 349
- 350
- 351
- 352
- 353
- 354
- 355
- 356
- 357
- 358
- 359
- 360
- 361
- 362
- 363
- 364
- 365
- 366
- 367
- 368
- 369
- 370
- 371
- 372
- 373
- 374
- 375
- 376
- 377
- 378
- 379
- 380
- 381
- 382
- 383
- 384
- 385
- 386
- 387
- 388
- 389
- 390
- 391
- 392
- 393
- 394
- 395
- 396
- 397
- 398
- 399
- 400
- 401
- 402
- 403
- 404
- 405
- 406
- 407
- 408
- 409
- 410
- 411
- 412
- 413
- 414
- 415
- 416
- 417
- 418
- 419
- 420
- 421
- 422
- 423
- 424
- 425
- 426
- 427
- 428
- 429
- 430
- 431
- 432
- 433
- 434
- 435
- 436
- 437
- 438
- 439
- 440
- 441
- 442
- 443
- 444
- 445
- 446
- 447
- 448
- 449
- 450
- 451
- 452
- 453
- 454
- 455
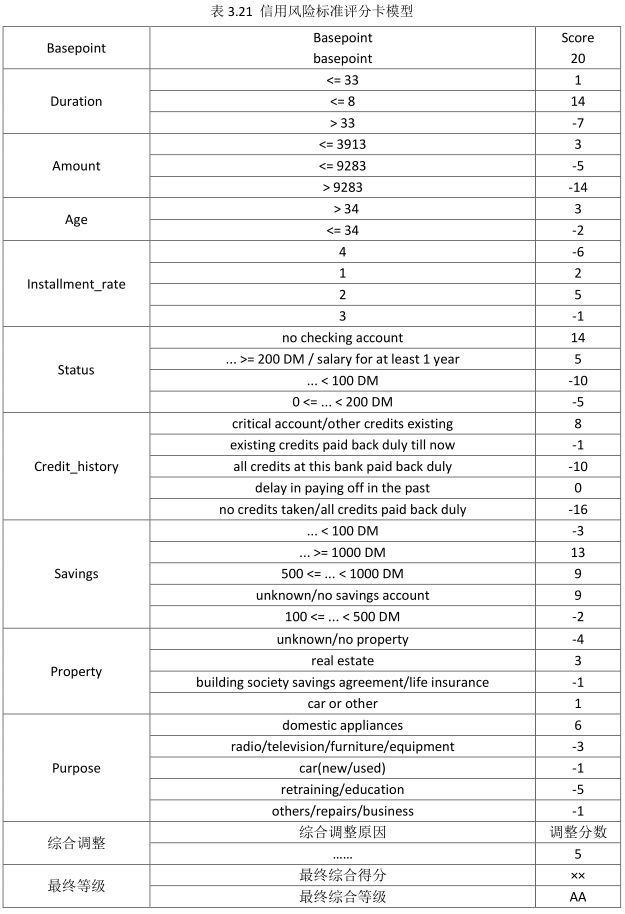
需要特别说明的是,上述开发的信用风险评级模型只包含定量和定性两部分,在实际的使用中还要充分考虑到信用风险的特定,增加综合调整部分,以应对可能对客户信用影响较大的突发事件,如客户被刑事起诉、遭遇重大疾病等。完整的信用风险标准评分卡模型,如表3.21所示:
使用小样本开发信用风险评级模型时,通常采用交叉验证(如五折交叉验证)的方法以提高模型的稳定性。由于上述代码采用的是随机抽样,每次抽取样本总体的80%作为样本集,来进行模型开发,剩余样本总体的20%用作模型测试。模型开发过程中,只需要运行上述代码4次,并对得到的标准评分卡、模型中每项的分值取平均值,即可得到最终的标准评分卡模型。
3.7 主标尺设计及模型验证
在上一节中开发的信用风险评分卡模型,得到的是不同风险等级客户对应的分数,我们还需要将分数与违约概率和评级符号联系起来,以便差异化管理证券公司各面临信用风险敞口的客户,这就需要对证券公司各面临信用风险敞口业务中的个人客户开发一个一致的主标尺。最容易理解、最容易操作的方式就是根据违约概率从低到高分为不同的区间,这就相当于把违约概率这把尺子标上刻度,用这把尺子可以把证券公司需承担信用风险敞口的不同业务中的个人客户划分到不同的信用等级,这样各项业务中个人客户的信用等级分布差异、信用风险分布高低,就可以一目了然地展现出来了。这种违约概率和信用等级之间的映射关系就称为主尺标。
由逻辑回归方程原理的分析可知,客户的违约概率p=Odds/(1+Odds),由式
Score=A-Blog(Odds)中得分与违约概率和Odds之间的对应关系,我们可计算出客户得分对应的违约概率。
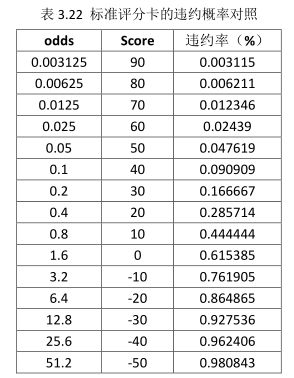
由信用风险标准评分卡可知,该评分卡的最高分是89分,最低分是-41分。因此,我们可以计算出该评分卡所有得分范围对应的违约概率:
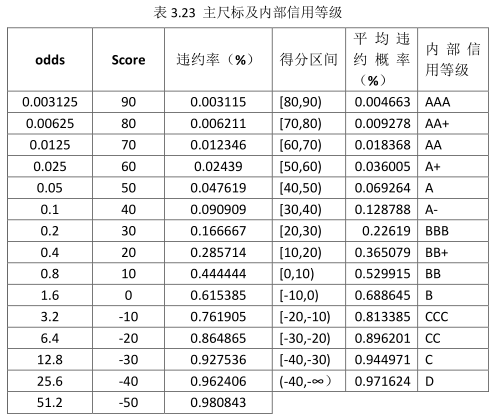
根据表3.22的结果可见,我们可简单地将每10分对应一个信用等级,并用每相邻得分对应的违约概率(这种方法计算得出的违约概率只能用作风险排序,而不是客户的真实违约概率)的算术平均值作为该信用风险等级对应的平均违约概率,得到最终的主尺标及其内部信用等级对照表3.23:
在主标尺和内部信用等级确定后,接下来我们需要进行模型的区分能力、预测准确度和稳定性等模型的验证工作了。回顾模型开发的过程,在模型开发时我们采用随机抽样的方法将数据分为样本集和测试集,并用样本集开发模型,用测试集做模型验证。因此,做模型验证时,我们应当首先用开发好的模型对测试集中的每一个样本评级一遍,并根据评级结果来计算模型的区分能力和预测准确度。
用已开发好的模型对测试集中所有样本重新评级一遍的代码如下:
tmp1<-test_kfolddata[,-21]
credit_risk1<-ifelse(test_kfolddata[,"credit_risk"]=="good",0,1)
data_tmp<-as.matrix(cbind(tmp1,credit_risk1))
##降维purpose(对测试集中的样本做同样的降维处理)##
for(i in 1:nrow(data_tmp))
{
  #合并car(new)、car(used)
  if(as.character(data_tmp[i,"purpose"])=="car (new)")
  {
    data_tmp[i,"purpose"]<-as.character("car(new/used)")
  }
  if(as.character(data_tmp[i,"purpose"])=="car (used)")
  {
    data_tmp[i,"purpose"]<-as.character("car(new/used)")
  }
  #合并radio/television、furniture/equipment
  if(as.character(data_tmp[i,"purpose"])=="radio/television")
  {
    data_tmp[i,"purpose"]<-as.character("radio/television/furniture/equipment")
  }
  if(as.character(data_tmp[i,"purpose"])=="furniture/equipment")
  {
    data_tmp[i,"purpose"]<-as.character("radio/television/furniture/equipment")
  }
  #合并others、repairs、business
  if(as.character(data_tmp[i,"purpose"])=="others")
  {
    data_tmp[i,"purpose"]<-as.character("others/repairs/business")
  }
  if(as.character(data_tmp[i,"purpose"])=="repairs")
  {
    data_tmp[i,"purpose"]<-as.character("others/repairs/business")
  }
  if(as.character(data_tmp[i,"purpose"])=="business")
  {
    data_tmp[i,"purpose"]<-as.character("others/repairs/business")
  }
  #合并retraining、education
  if(as.character(data_tmp[i,"purpose"])=="retraining")
  {
    data_tmp[i,"purpose"]<-as.character("retraining/education")
  }
  if(as.character(data_tmp[i,"purpose"])=="education")
  {
    data_tmp[i,"purpose"]<-as.character("retraining/education")
  }
}
##purpose变量降维结束##
###用R代码实现打分卡模型###
data1<-as.data.frame(data_tmp)
tot<-nrow(data1)
score<-list()
for(i in 1:tot)
{
  lst<-as.matrix(data1[i,])
  #duration
  score_duration<-NA
  if(lst[,"duration"]<=8)
  {
    score_duration<-14
  }else
  if(lst[,"duration"]>8&lst[,"duration"]<=33)
  {
    score_duration<-1
  }else
  if(lst[,"duration"]>33)
  {
    score_duration<--7
  }
  #amount
  score_amount<-NA
  if(lst[,"amount"]<=3913)
  {
    score_amount<-3
  }else
    if(lst[,"amount"]>3913&lst[,"amount"]<=9283)
    {
      score_amount<--5
    }else
      if(lst[,"amount"]>9283)
      {
        score_amount<--14
      }
  #age
  score_age<-NA
  if(lst[,"age"]<=34)
  {
    score_age<--2
  }else
    if(lst[,"age"]>34)
    {
      score_age<-3
    }
  #installment_rate
  score_installment_rate<-NA
  if(lst[,"installment_rate"]==1)
  {
    score_installment_rate<-2
  }else
    if(lst[,"installment_rate"]==2)
    {
      score_installment_rate<-5
    }else
      if(lst[,"installment_rate"]==3)
      {
        score_installment_rate<--1
      }else
        if(lst[,"installment_rate"]==4)
        {
          score_installment_rate<--6
        }
  #status
  score_status<-NA
    if(lst[,"status"]=="... < 100 DM")
    {
      score_status<--10
    }else
      if(lst[,"status"]=="0 <= ... < 200 DM")
      {
        score_status<--5
      }else
      if(lst[,"status"]=="... >= 200 DM / salary for at least 1 year")
      {
        score_status<-5
      }else
        if(lst[,"status"]=="no checking account")
        {
          score_status<-14
        }
  #credit_history
  score_credit_history<-NA
  if(lst[,"credit_history"]=="critical account/other credits existing")
  {
    score_credit_history<-8
  }else
    if(lst[,"credit_history"]=="existing credits paid back duly till now")
    {
      score_credit_history<--1
    }else
      if(lst[,"credit_history"]=="all credits at this bank paid back duly")
      {
        score_credit_history<--10
      }else
        if(lst[,"credit_history"]=="delay in paying off in the past")
        {
          score_credit_history<-0
        }else
          if(lst[,"credit_history"]=="no credits taken/all credits paid back duly")
          {
            score_credit_history<--16
          }
  #savings
  score_savings<-NA
  if(lst[,"savings"]=="... < 100 DM")
  {
    score_savings<--3
  }else
    if(lst[,"savings"]=="... >= 1000 DM")
    {
      score_savings<-13
    }else
      if(lst[,"savings"]=="500 <= ... < 1000 DM")
      {
        score_savings<-9
      }else
        if(lst[,"savings"]=="unknown/no savings account")
        {
          score_savings<-9
        }else
          if(lst[,"savings"]=="100 <= ... < 500 DM")
          {
            score_savings<--2
          }
  #property
  score_property<-NA
  if(lst[,"property"]=="unknown/no property")
  {
    score_property<--4
  }else
    if(lst[,"property"]=="real estate")
    {
      score_property<-3
    }else
      if(lst[,"property"]=="building society savings agreement/life insurance")
      {
        score_property<--1
      }else
        if(lst[,"property"]=="car or other")
        {
          score_property<-1
        }
  #purpose
  score_purpose<-NA
  if(lst[,"purpose"]=="domestic appliances")
  {
    score_purpose<-6
  }else
    if(lst[,"purpose"]=="radio/television/furniture/equipment")
    {
      score_purpose<--3
    }else
      if(lst[,"purpose"]=="car(new/used)")
      {
        score_purpose<--1
      }else
        if(lst[,"purpose"]=="retraining/education")
        {
          score_purpose<--5
        }else
          if(lst[,"purpose"]=="others/repairs/business")
          {
            score_purpose<--1
          }
  score[i]<-sum(20,score_duration,score_amount,score_age,score_installment_rate,
                score_status,score_credit_history,score_savings,
                score_property,score_purpose)
  rm(lst)
}
###用R代码实现打分卡模型结束###
#合并处理测试集样本得分,并输出到指定的CSV文件中#
score_M<-as.matrix(score,ncol=1)
score_data<-cbind(data1,score_M)
score_risk<-score_data[,c("credit_risk1","score_M")]
write.csv(as.matrix(score_risk),"C:/Users/ZL/Desktop/creditcard_model/2.csv")
- 1
- 2
- 3
- 4
- 5
- 6
- 7
- 8
- 9
- 10
- 11
- 12
- 13
- 14
- 15
- 16
- 17
- 18
- 19
- 20
- 21
- 22
- 23
- 24
- 25
- 26
- 27
- 28
- 29
- 30
- 31
- 32
- 33
- 34
- 35
- 36
- 37
- 38
- 39
- 40
- 41
- 42
- 43
- 44
- 45
- 46
- 47
- 48
- 49
- 50
- 51
- 52
- 53
- 54
- 55
- 56
- 57
- 58
- 59
- 60
- 61
- 62
- 63
- 64
- 65
- 66
- 67
- 68
- 69
- 70
- 71
- 72
- 73
- 74
- 75
- 76
- 77
- 78
- 79
- 80
- 81
- 82
- 83
- 84
- 85
- 86
- 87
- 88
- 89
- 90
- 91
- 92
- 93
- 94
- 95
- 96
- 97
- 98
- 99
- 100
- 101
- 102
- 103
- 104
- 105
- 106
- 107
- 108
- 109
- 110
- 111
- 112
- 113
- 114
- 115
- 116
- 117
- 118
- 119
- 120
- 121
- 122
- 123
- 124
- 125
- 126
- 127
- 128
- 129
- 130
- 131
- 132
- 133
- 134
- 135
- 136
- 137
- 138
- 139
- 140
- 141
- 142
- 143
- 144
- 145
- 146
- 147
- 148
- 149
- 150
- 151
- 152
- 153
- 154
- 155
- 156
- 157
- 158
- 159
- 160
- 161
- 162
- 163
- 164
- 165
- 166
- 167
- 168
- 169
- 170
- 171
- 172
- 173
- 174
- 175
- 176
- 177
- 178
- 179
- 180
- 181
- 182
- 183
- 184
- 185
- 186
- 187
- 188
- 189
- 190
- 191
- 192
- 193
- 194
- 195
- 196
- 197
- 198
- 199
- 200
- 201
- 202
- 203
- 204
- 205
- 206
- 207
- 208
- 209
- 210
- 211
- 212
- 213
- 214
- 215
- 216
- 217
- 218
- 219
- 220
- 221
- 222
- 223
- 224
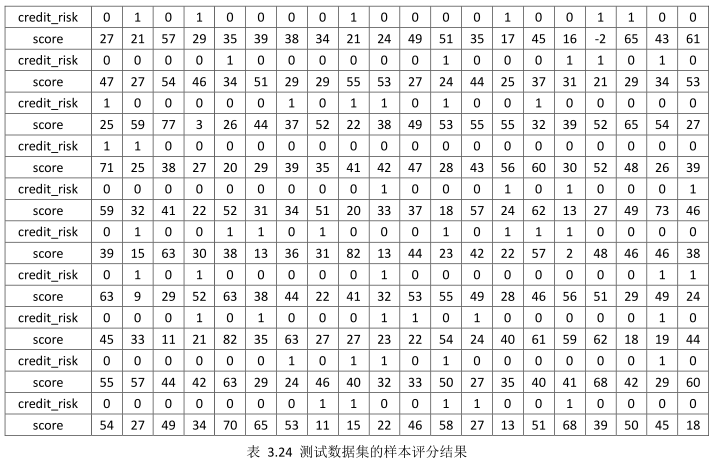
运行上述代码后,我们整理测试集中200个样本的评级计算结果,如下:
从理论上说,信用评级无法给出主体是否违约的判断,只能给出主体违约的概率,而评级符号对应的就是主体发生违约的平均违约概率。但对评级结果的实际应用中,实在存在评级结果是否“准确”的质疑。那么,通常情况下如果某主体被评级为投资级(BBB及以上),但发生了违约,则被认为“不准确”或者“误判”。如果某主体被评级为投机级(BB及以下),且发生了违约,则被认为“预测准确”。如果被评级为投机级的主体没发生违约事件(并不是每个被评级为投机级的主体都会发生违约),则可以用概率去解释,那就是“大概率事件并不一定发生,小概率事件也并不一定不发生”。
我们采用ROC作为模型区分能力的验证指标,采用AR(accuracy ratio,准确率)作为模型预测准确性的验证指标,并且两者存在AR=2×ROC-1的关系式。验证模型的稳定性需要多年的历史数据,由于数据原因此处略去。
由内部等级与主尺标的对应关系可知,投资级和投机级的分界点为20分,即大于20分的主体发生了违约,我们认为是“误判”,小于20分的主体为发生违约,我们也认为是“误判”。则经统计图 中的数据可知,误判的主体总数为50个,则AR=1-50/200=0.75,此时ROC=(1+AR)/2=0.875。此时模型的预测准确度和区分能力均达到了较好地要求,可以进行部署使用。
上述模型的验证方法采用的是将测试样本集中的所有样本在生成的评分卡中全部评级一遍的方法,当然也可以采用直接将WOE变量的逻辑回归方程作为评级模型的方法。此时,也需要将测试样本集中的所有入模变量计算其WOE,并代入上述逻辑回归方程。
3.8 模型实施
待模型开发和验证完毕后,紧接着就是模型的实施了。有条件的券商可借助业内先进的信用风险管理系统,来实现整个公司的信用风险统一管理。在对客户做信用评级时,应当遵守一个最基本的原则,那就是同一个客户在不同业务部门开展业务时,只能对应一个统一的评级结果。
3.9 模型监测与报告
在模型部署和实施完毕后,我们还需要定期监测模型的运行情况并形成模型监测报告。因为开发的模型是基于某一时间的特定样本的,随着时间的推移,证券公司的经验战略可能会发生变化,这将会导致样本发生变化,从而造成模型的区分能力和稳定性变差。因此,我们需要定期(通常每年至少一次)对模型的使用情况进行检测并报告模型区分能力和稳定性的变化情况,必要时应采取包括修正模型或重建模型等措施。
我们通常使用模型稳定性指数来衡量模型稳定性变化的情况,模型稳定性指数是计算实际的和预期的分数分布之间差异的一个衡量指标,具体的计算方法如表3.25所示。
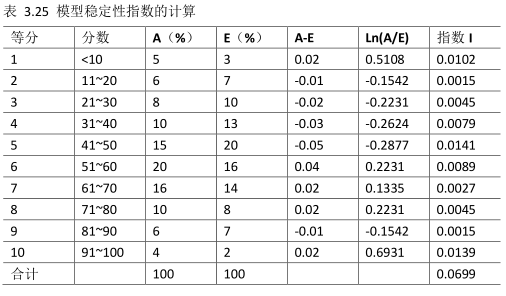
表3.25中,列A(%)表示验证数据集中每十分位间距中记录的百分比,列E(%)表示建模数据集中每十分位间距中记录的百分比。列(A-E)和Ln(A/E)分别表示这两个值的差以及这两个值的比率的自然对数,指数列示(A-E)列和Ln(A/E)列的乘积,模型稳定性指数是最后一列的和。
模型稳定性指数I的定义为:

模型稳定性指数衡量的是两个离散变量间的关联性,较低的取值表明这两个变量的类别分布相似。有卡方检验的定义可知,我们可以使用自由度为r-1的卡方分布检验模型稳定性指数的显著性。R语言中可使用pchisq()函数计算出两个变量分布不同的概率:
pchisq(0.0699,df=9) #模型稳定性指数为0.0699,自由度为9
[1] 5.178963e-09
- 1
- 2
- 3
由输出结果可知,变量A和变量E分布的不同的概率为5.178963e-09,非常非常小,这说明变量A和变量E的分布是相同的。
为了得到使用模型稳定性指数衡量真实(变量A)和预期(变量E)的分值分布之间的显著性差异的准则,我们可以使用R函数qchisq(),即pchisq()函数的逆,获取显著性水平为0.65和0.997时的指数水平。结果如下所示,这两个值分别为I=0.10和I=0.25。
qchisq(0.65,df=9)       #结果为百分数
[1] 10.006
qchisq(0.997,df=9)      #结果为百分数
[1] 24.97407
- 1
- 2
- 3
- 4
- 5
根据上述计算,信用风险评级模型使用模型稳定性指数的最优实践准则如表3.26所示。

表3.26表明,根据卡方显著性计算,稳定性指数高于0.25时,两个数据集的分值分布显著不同的概率为99.7%。此时,我们需要对出现这种变化的原因进入深入调查,甚至需要新建评分卡。同样,稳定性指数小于0.1时,连个数据集的分值分布显著不同的概率为65%。此时,我们不需要采取任何行动。稳定性指数在上述两个极端值之间时,表明模型的稳定性发生了某些变化,需要对模型进行回归测试,并检查原因。
