LaTeX论文写作的一些用法记录
常用宏包汇总
\usepackage{amsmath}
\usepackage{booktabs}
\usepackage{amssymb}
\usepackage{amsbsy}
\usepackage{multirow}
%\usepackage{float}
\usepackage{graphicx}
\usepackage{subfigure}
\usepackage{array}
\usepackage{caption}
\usepackage{url}

%\usepackage{algorithmic}
%\usepackage{algorithm}
%\usepackage{algorithmic}
%\usepackage{algpseudocode}
%\usepackage{pseudocode}
%\usepackage{algorithm}
\usepackage{algorithmic}

\usepackage{array}
\newcolumntype{L}[1]{>{\raggedright\let\newline\\\arraybackslash\hspace{0pt}}m{#1}}
\newcolumntype{C}[1]{>{\centering\let\newline\\\arraybackslash\hspace{0pt}}m{#1}}
\newcolumntype{R}[1]{>{\raggedleft\let\newline\\\arraybackslash\hspace{0pt}}m{#1}}
图片
* 测试图片来源 半次元:巨蜥不是十晰x [手动眨眼]
基本用法
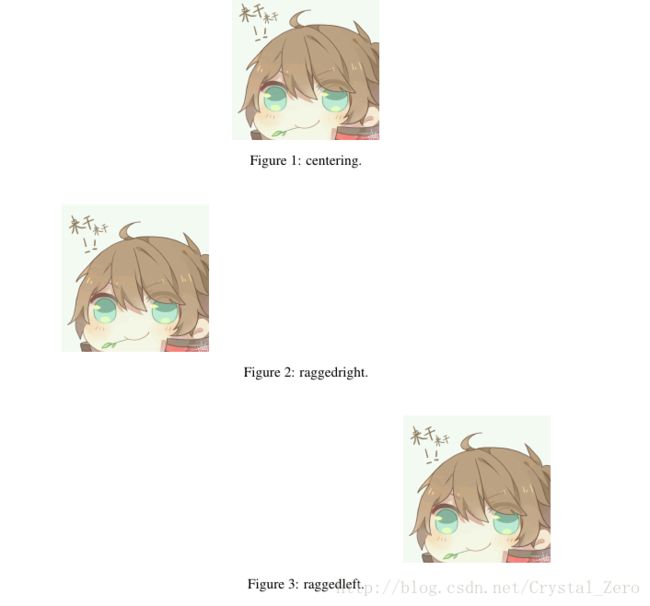
\begin{figure}[Htbp]
	\centering % 居中对齐
	\includegraphics[width=0.7\textwidth]{test.pdf}
    \caption{Add caption here.}
     \label{Fig:test}
\end{figure}
图片对齐
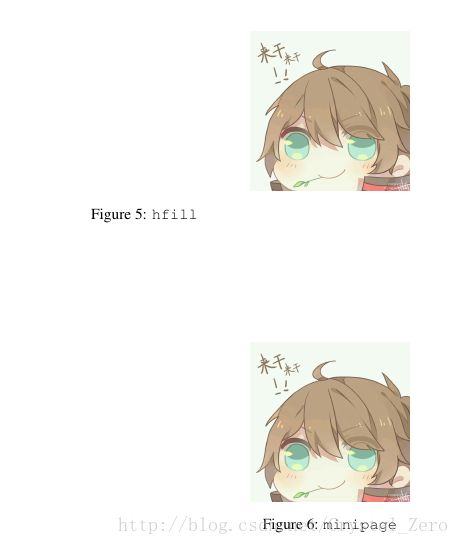
上例是居中对齐,对应的还有左对齐和右对齐。
\begin{figure}[htbp]
	\raggedright % 左对齐
	\includegraphics[width=0.3\textwidth]{test.jpg}
    \caption{align left.}
     \label{Fig:tag_left}
\end{figure}
\begin{figure}[htbp]
	\raggedleft % 右对齐
	\includegraphics[width=0.3\textwidth]{test.jpg}
    \caption{align right.}
     \label{Fig:tag_right}
\end{figure}
关于对齐还有其他的实现方式
Syntax similar to \centering for right and left?
一种方式是利用adjustbox 宏包,但是一般CTEX(老版本,新版本不造)并没有安装这个宏包,学不来的,散了散了
\documentclass{article}
\usepackage[export]{adjustbox}

\begin{document}

\begin{figure}
    \includegraphics[width=.6\textwidth,center]{example-image}
    \caption{centered image}
\end{figure}

\begin{figure}
    \includegraphics[width=.6\textwidth,left]{example-image}
    \caption{left aligned image}
\end{figure}

\begin{figure}
    \includegraphics[width=.6\textwidth,right]{example-image}
    \caption{right aligned image}
\end{figure}

\end{document}
还有几种方式一并列下:
\begin{figure}[htbp]
	\flushleft % 左对齐,对应\flushright右对齐
	\includegraphics[width=0.3\textwidth]{test.jpg}
    \caption{flushright.}
\end{figure}

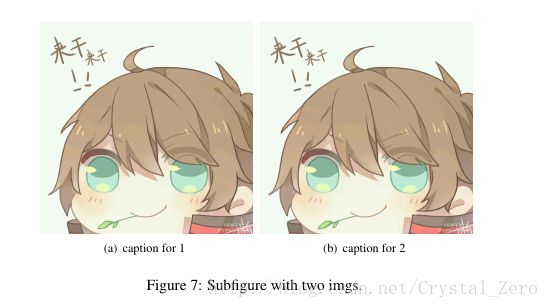
\begin{figure}
	\hfill\includegraphics[width=0.3\textwidth]{test.jpg} %暴力右对齐
	\caption{\texttt{hfill}}
\end{figure}

\begin{figure}
	%这里利用了一个minipage环境,其实区别在于caption上
	\hfill\begin{minipage}{.5\textwidth}\centering
	\includegraphics{n}
	\caption{\texttt{minipage}}
	\end{minipage}
\end{figure}
多图片排版
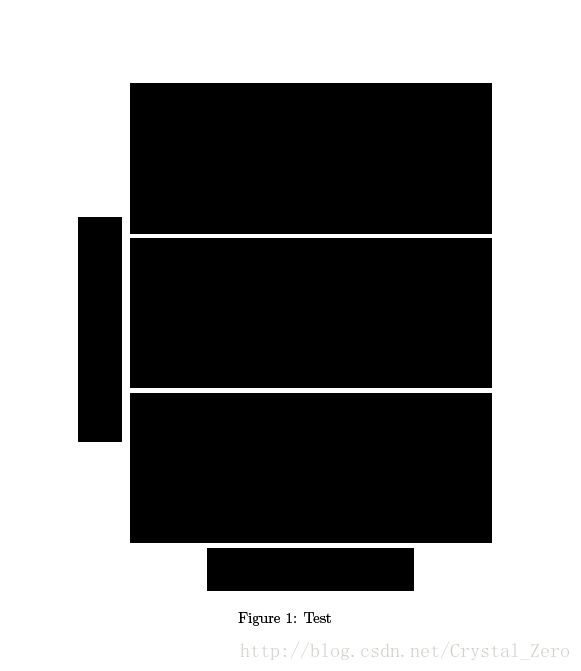
我常用的是subfigure环境,采用宏包graphicx和subfigure
下面是一个两个图的例子,当然更多图也是可以滴
\begin{figure}[htbp]
\centering
\subfigure[caption for 1]{
\label{Fig.sub.1}
\includegraphics[width=0.4\textwidth]{test.jpg}}
\subfigure[caption for 2]{
\label{Fig.sub.2}
\includegraphics[width=0.4\textwidth]{test.jpg}}
\caption{Subfigure with two imgs.}
\label{Fig:demo_sub}
\end{figure}
关于其他用法,下面给出一些参考
Insert multiple figures in Latex
Placing figures/tables side-by-side (\subfig)
How to arrage multiple figures?
***Using the multirow environment
采用multirow和multicolumn能解决大部分的排版问题,这里采用multirow方式的源码和结果如下:
\documentclass[a4paper]{article}
\usepackage[demo]{graphicx}

\usepackage{multirow}
\begin{document}


\begin{figure}[h]
    \centering
    \begin{tabular}{c@{}c@{}}
      \multirow{-6}{*}{\includegraphics[height=1cm,angle=90]{vertical.jpg}}
        &
      \begin{tabular}{l}
        \includegraphics[trim = 0mm 0mm 0mm 0mm, clip, width=0.7\linewidth]{1.jpg} \tabularnewline
        \includegraphics[trim = 0mm 0mm 0mm 0mm, clip, width=0.7\linewidth]{1.jpg} \tabularnewline
        \includegraphics[trim = 0mm 0mm 0mm 0mm, clip, width=0.7\linewidth]{1.jpg} \tabularnewline
      \end{tabular} \tabularnewline
      & \multicolumn{1}{c}{\includegraphics[width=0.4\linewidth,height=1cm]{horizontal.jpg}}
    \end{tabular}
    \caption{Test}
    \label{figTest}
\end{figure}


\begin{figure}[h]
    \centering
    \begin{tabular}{c@{}c@{}}
      \multirow{-4}{*}{\rotatebox{90}{\LARGE \bfseries Error (mm)}}
        &
      \begin{tabular}{l}
        \includegraphics[trim = 0mm 0mm 0mm 0mm, clip, width=0.7\linewidth]{1.jpg} \tabularnewline
        \includegraphics[trim = 0mm 0mm 0mm 0mm, clip, width=0.7\linewidth]{1.jpg} \tabularnewline
        \includegraphics[trim = 0mm 0mm 0mm 0mm, clip, width=0.7\linewidth]{1.jpg} \tabularnewline
      \end{tabular} \tabularnewline
      & \tabularnewline
      & \LARGE \bfseries Time (s)  \tabularnewline
    \end{tabular}
    \caption{Other Test}
    \label{figOtherTest}
\end{figure}

\end{document}
表格
基本用法
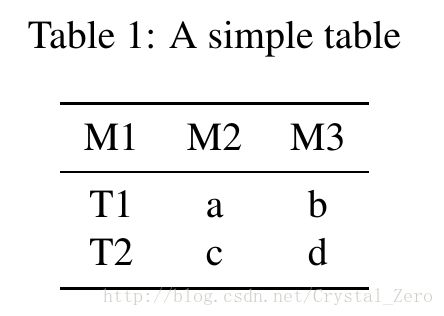
最常用的三线表
\begin{table}[!htbp]
\caption{A simple table}
\centering
\begin{tabular}{ccc}
\toprule
M1 & M2 & M3 \\
\midrule
T1 & a & b \\
T2 & c & d \\
\bottomrule
\end{tabular}
\end{table
表格对齐与列宽设置
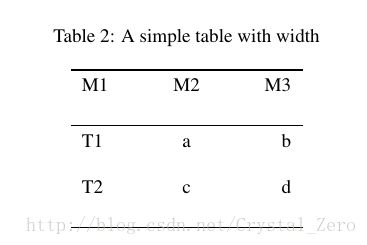
一种粗暴但好用的方法
\begin{table}[!htbp]
\caption{A simple table with width}
\centering
%\begin{tabular}{ccc}
\begin{tabular}{p{1cm}<{\flushleft}p{1cm}<{\centering}p{1cm}<{\raggedleft}}
\toprule
M1 & M2 & M3 \\
\midrule
T1 & a & b \\
T2 & c & d \\
\bottomrule
\end{tabular}
\end{table}
当列比较多时,这种写法会比较长,看起不太优雅(要优雅~)
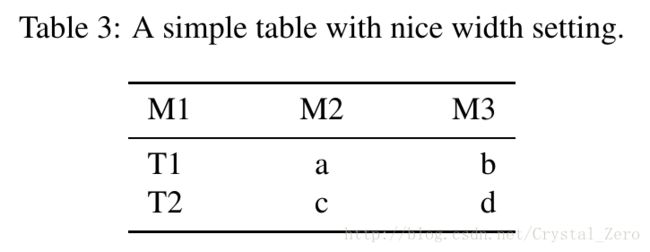
后来我发现一种灰常nice的写法
\usepackage{array}
\newcolumntype{L}[1]{>{\raggedright\let\newline\\\arraybackslash\hspace{0pt}}m{#1}}
\newcolumntype{C}[1]{>{\centering\let\newline\\\arraybackslash\hspace{0pt}}m{#1}}
\newcolumntype{R}[1]{>{\raggedleft\let\newline\\\arraybackslash\hspace{0pt}}m{#1}}

\begin{table}[!htbp]
\caption{A simple table with nice width setting.}
\centering
%\begin{tabular}{ccc}
%\begin{tabular}{p{1cm}<{\flushleft}p{1cm}<{\centering}p{1cm}<{\raggedleft}}
\begin{tabular}{L{1cm}C{1cm}R{1cm}}
\toprule
M1 & M2 & M3 \\
\midrule
T1 & a & b \\
T2 & c & d \\
\bottomrule
\end{tabular}
\end{table}
复杂表格结构
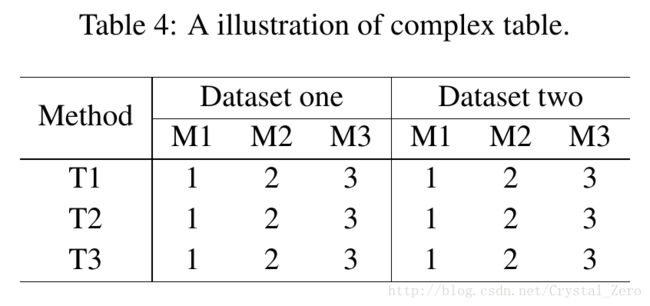
就像之前在图片中提到的,采用multirow和multicolumn能解决大部分的排版问题
这里给出一个简单的例子来说明具体的使用
\begin{table}[!htbp]
%\small
\renewcommand{\arraystretch}{1.1}
\caption{A illustration of complex table. }
\label{tab:mypersonality}
\centering
 %\begin{tabular}{{c}p{100pt}{l}p{80pt}{l}p{200pt}}
\begin{tabular}{c|ccc|ccc}
%\begin{tabular}{cccccccccc}
%\toprule
\hline
\multirow{2}{*}{Method} &
\multicolumn{3}{c|}{Dataset one} &
\multicolumn{3}{c}{Dataset two} \\
\cline{2-7}
 & M1  & M2   & M3   & M1  & M2   & M3  \\
%\midrule
\hline
T1    & 1 & 2 & 3 & 1 & 2 & 3  \\
T2    & 1 & 2 & 3 & 1 & 2 & 3  \\
T3    & 1 & 2 & 3 & 1 & 2 & 3  \\
\hline
%\bottomrule
\end{tabular}
%\vspace{-1.5em}
\end{table}
改变表格行高
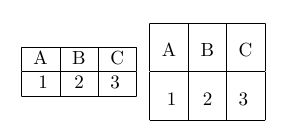
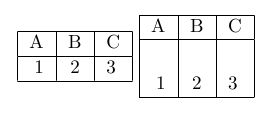
有两种,一种是全局改变,一种是局部改变某一行的行高
给出一篇文章 row height,里面具体给出了两个例子分别说明这两个问题。
\documentclass{article}
\begin{document}
\begin{tabular}{|r|c|l|}
\hline
A & B & C \\
\hline
1 & 2 & 3 \\
\hline
\end{tabular}
\renewcommand{\arraystretch}{2} %改变整个表格环境的行高
\begin{tabular}{|r|c|l|}
\hline
A & B & C \\
\hline
1 & 2 & 3 \\
\hline
\end{tabular}
\renewcommand{\arraystretch}{1}
\end{document}\documentclass{article}
\begin{document}
\begin{tabular}{|r|c|l|}
\hline
A & B & C \\
\hline
1 & 2 & 3 \\
\hline
\end{tabular}
\begin{tabular}{|r|c|l|}
\hline
A & B & C \\
\hline
%use the command \rule with a width of zero and the height you want as parameter
\rule{0pt}{25pt}1 & 2 & 3 \\
\hline
\end{tabular}
\end{document}伪代码
用latex写伪代码的教程有很多,比如How to write algorithm and pseudocode in Latex ?
但是最近有些模板,比如IEEE的conference模板,对与algorithm宏包会报错不兼容。
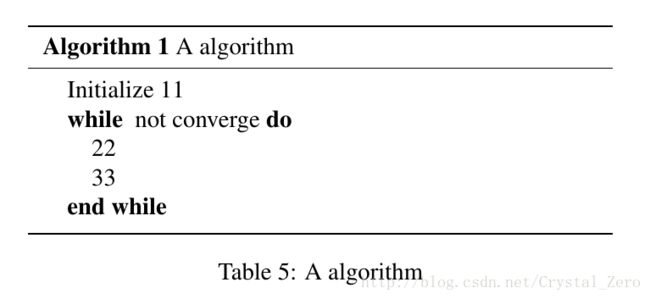
我采用的解决方式是,将algorithmic放在Table或者Figure环境里。
具体给出放在Table里的例子
\begin{table}[!htbp]
%\renewcommand{\arraystretch}{1}
\centering
\begin{tabular}{p{8cm}}
\toprule
%\hline
%\specialrule{1pt}{5pt}{5pt}
\textbf{Algorithm 1} A algorithm\\
\midrule
%\hline
%\specialrule{1pt}{1pt}{1pt}
%\rule{-5pt}{-5pt}
%\setlength{\parskip}{-10pt}
{
\vspace{-8pt}
%\setlength{\abovecaptionskip}{-20pt}
%\setlength{\belowcaptionskip}{-20pt}
\begin{algorithmic}
\STATE  Initialize  11
\WHILE{ not converge}
\STATE 22
\STATE 33
\ENDWHILE
\end{algorithmic}
} \setlength{\parskip}{-10pt}\\
%\specialrule{0em}{-1pt}{-1pt}
\bottomrule
%\hline
%\specialrule{1pt}{1pt}{1pt}
\end{tabular}
\caption{ A algorithm}
\end{table}
一些间距调整
主要是图表与正文的间距、图表之间的间距
记录下采用过的方法
\hspace{}
\vspace{-1.5em}
\rule{-5pt}{-5pt}
\setlength{\parskip}{-10pt}
\specialrule{0em}{-1pt}{-1pt}
\renewcommand{\arraystretch}{1}
\setlength{\abovecaptionskip}{-20pt}
\setlength{\belowcaptionskip}{-20pt}
特殊符号
- L L : \mathcal{L}
- Yˆ Y ^ : \widehat{Y}
- Intel\textsuperscript{\textregistered} Core \texttrademark \texttrademark : \textsuperscript{\textregistered} , \texttrademark
- ∂O(θ)∂α ∂ O ( θ ) ∂ α : \frac{\partial \mathcal{O}(\theta)}{\partial \alpha}
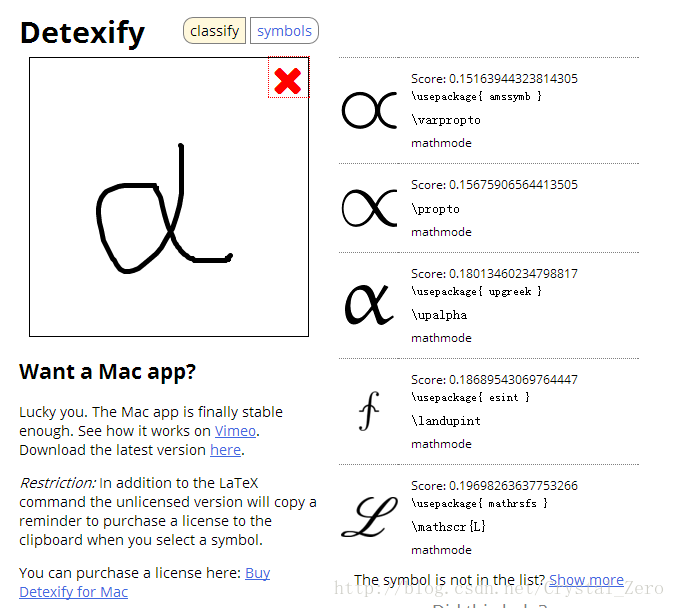
给出一个符号的比较好玩的网站: Detexify
左边手绘,右边给出候选,虽然很多时候不准2333
公式
公式不编号: \nonumber
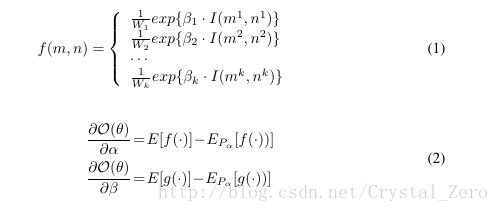
我碰到的一些稍微复杂一点的公式
\begin{eqnarray}
 f( m, n) =
 \left\{ \begin{array}{l}
 \frac{1}{W_1} exp\{\beta_1 \cdot I(m^1, n^1)\}\\
 \frac{1}{W_2} exp\{\beta_2 \cdot I(m^2, n^2)\}\\
 \cdots \\
 \frac{1}{W_k} exp\{\beta_k \cdot I(m^k, n^k)\}
 \end{array} \right.
\end{eqnarray}
\begin{equation}
\begin{split}
&\frac{\partial \mathcal{O}(\theta)}{\partial \alpha}  \! =\!  E[ f(\cdot)]
\! - \! E_{P_{\alpha}}[ f(\cdot)) ] \\
&\frac{\partial \mathcal{O}(\theta)}{\partial \beta}  \! =\!  E[ g(\cdot)]
\! - \! E_{P_{\alpha}}[ g(\cdot)) ] \\
\end{split}
\end{equation
\begin{equation}
\begin{split}
\frac{\partial \mathcal{O}(\theta)}{\partial \alpha}  & =  E[ f(\cdot)] - E_{P_{\alpha}}[ f(\cdot)) ] \\
	& \hspace{2em} + E[ g(\cdot)]  -  E_{P_{\alpha}}[ g(\cdot)) ] \\
\end{split}
\end{equation}
注意公式编号,这里都是用了split环境,多个公式只编一个号
拖了好久,整理了一部分,剩下的记起来或用到了再添加。
最近发现,如果公式过长,只需要左对齐就好,\flalign+amsmath宏包,记录一下
\begin{flalign}
& f_1 = 1+1+1+1+1+11+1+11+1+11+1+11+1+1
& f_2 = 2+2+2+2+2+2+2+2+2+2+2+2+2+2+2+2
& f_3 = 3+3+3+3+3+3+3+3+3+3+3+3+3+3+3+3
\end{flalign}