Python中Numpy和matplotlib的使用
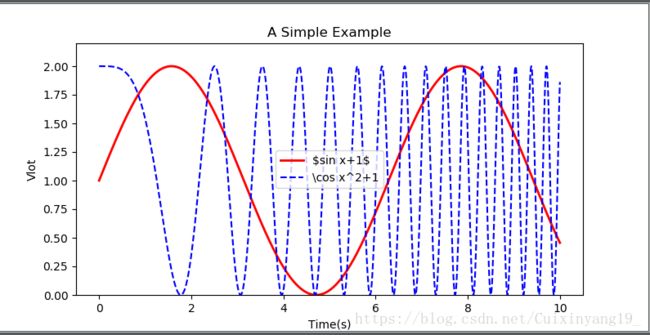
一、使用Matplotlib画函数图
1.代码实例
import numpy as np
import matplotlib.pyplot as plt

x = np.linspace(0,10,1000) #自变量
y = np.sin(x) + 1
z = np.cos(x**2) + 1

plt.figure(figsize = (8,4)) #设置图像大小
plt.plot(x,y,label = '\$sin x+1$',color = 'red',linewidth = '2')#作图,设置标签,线条颜色,大小
plt.plot(x,z,'b--',label='\cos x^2+1')
plt.xlabel('Time(s)') #x轴名称
plt.ylabel('Vlot') #y轴名称
plt.title('A Simple Example')#标题
plt.ylim(0,2.2) #y轴范围
plt.legend()#显示图例
plt.show()#显示作图结果
2.运行结果
二、使用Numpy进行基本运算
1.创建矩阵
#coding=utf-8
import numpy as np #函数库导入
mat1 = np.array([[7,5,7,2],[42,54,45,43],[10,8,15,14]])#三行四列的矩阵
print('mat1:', '\n',mat1)#输出显示
运行结果:

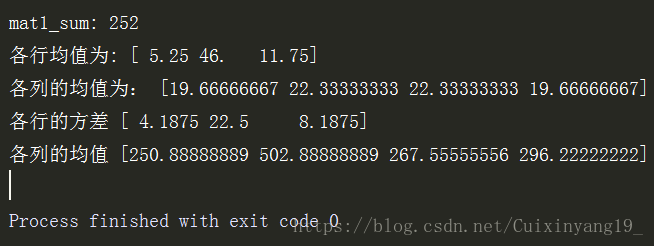
2.求和,各行均值及方差
#coding=utf-8
import numpy as np #函数库导入
mat1 = np.array([[7,5,7,2],[42,54,45,43],[10,8,15,14]])#三行四列的矩阵
print('mat1:', '\n',mat1)#输出显示
mat_sum = mat1.sum() #求和
print('mat1_sum:',mat_sum)
mat1_mean = np.mean(mat1)
#计算各行均值
mat1Row_mean = np.mean(mat1,axis=1)#计算每一行的均值
mat1Column_mean = np.mean(mat1,axis=0)#计算每一列的均值
print('各行均值为:',mat1Row_mean)
print('各列的均值为:',mat1Column_mean)
#计算各行方差
mat1Row_var = np.var(mat1,axis=1) #此处除以n
mat1Column_var = np.var(mat1,axis=0)
print('各行的方差',mat1Row_var)
print('各列的均值',mat1Column_var)
运行结果:
此处的方差计算公式为:
S=1N∑ni(Xi−X¯¯¯¯)2 S = 1 N ∑ i n ( X i − X ¯ ) 2
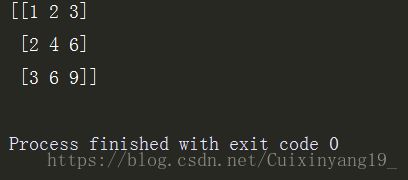
3.矩阵相乘
#矩阵相乘
mat2 = np.array([[1,2,3]])
mat3 = np.array([[1,2,3]])
mat2_3 = mat2.transpose()*mat3 #mat2.transpose()为矩阵转置
print(mat2_3)
运行结果