使用Tensorboard——TensorFlow可视化2
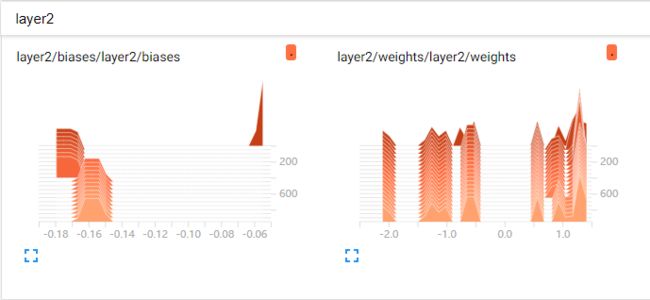
效果如下列图所示。
代码如下:
import tensorflow as tf
import numpy as np
import matplotlib.pyplot as plt

#构造添加一个神经层的函数
def add_layer(inputs,in_size,out_size,n_layer,activation_function=None):
    layer_name='layer%s' % n_layer
    with tf.name_scope(layer_name):#define layer name,图层的名字叫layer
        with tf.name_scope('weights'):#define weights name
            Weights=tf.Variable(tf.random_normal([in_size,out_size]),
                                name='W')
            #老版的TensorFlow的该函数为 tf.histogram_summary()
            tf.summary.histogram(layer_name+'/weights',Weights)
        with tf.name_scope('biases'):#define biases
            biases=tf.Variable(tf.zeros([1,out_size])+0.1,
                               name='b')#biases的建议值不为0,故加上0.1
            tf.summary.histogram(layer_name + '/biases', biases)
        with tf.name_scope('Wx_plus_b'):
            Wx_plus_b=tf.matmul(inputs,Weights)+biases
        if activation_function is None:
            outputs=Wx_plus_b
        else:
            outputs=activation_function(Wx_plus_b)
            tf.summary.histogram(layer_name + '/outputs', outputs)
        return outputs

#导入数据
x_data=np.linspace(-1,1,300,dtype=np.float32)[:,np.newaxis]
noise=np.random.normal(0,0.05,x_data.shape).astype(np.float32)
y_data=np.square(x_data)-0.5+noise

#None代表无论输入有多少都可以,因为输入只有一个特征,所以这里是1
with tf.name_scope('inputs'):#形成一个大的图层,包围xs和ys,图层的名字叫inputs
    xs=tf.placeholder(tf.float32,[None,1],name='x_in')#为xs指定名称为x_in
    ys=tf.placeholder(tf.float32,[None,1],name='y_in')#为ys指定名称为y_in


#搭建网络
#输入层为1层、隐藏层为10层、输出层也为1层的神经网络
#添加隐藏层
L1=add_layer(xs,1,10,n_layer=1,activation_function=tf.nn.relu)#使用TensorFlow自带的激励函数tf.nn.relu

#此处的10为隐藏层的10个输出,将它作为输出层的输入;1则表示输出层只有一个输出
#计算所得的prediction的值即是所求的预测值
#添加输出层
prediction=add_layer(L1,10,1,n_layer=2,activation_function=None)

#计算预测值prediction和真实值的误差,对二者差的平方求和再取平均
with tf.name_scope('loss'):
    loss=tf.reduce_mean(tf.reduce_sum(tf.square(ys-prediction),
                                      reduction_indices=[1]))
    #老版的TensorFlow的该函数为tf.scalar_summary()
    tf.summary.scalar('loss',loss)#观看loss的变化很重要

#使用梯度下降算法来最小化误差loss,学习率为0.1
with tf.name_scope('train'):
    train_step=tf.train.GradientDescentOptimizer(0.1).minimize(loss)

#初始化所有变量
init=tf.global_variables_initializer()

#定义Session,用来执行初始化操作
sess=tf.Session()
#老版的TensorFlow的该函数为tf.merge_all_summaries()
merged=tf.summary.merge_all()#将所有的summary合并打包
writer=tf.summary.FileWriter("logs/",sess.graph)#将整个 框架加载到一个文件
sess.run(init)

#plot the real data
fig=plt.figure()#生成一个图片框
ax=fig.add_subplot(1,1,1)#连续画图
ax.scatter(x_data,y_data)#画散点图
plt.ion()#程序遇到show会暂停,故用它保持程序持续运行
plt.show()

#训练
for i in range(1000):
    sess.run(train_step,feed_dict={xs:x_data,ys:y_data})
    if i % 50 ==0:
        result=sess.run(merged,feed_dict={xs:x_data,ys:y_data})
        writer.add_summary(result,i)#将result加入到 summary中,i是训练的次数
        print(sess.run(loss,feed_dict={xs:x_data,ys:y_data}))
        #先抹除当前的线,再画新的线
        try:
            #抹除当前的线,因第一次没有线可以抹除,会报错,所以用try来捕捉异常
            ax.lines.remove(lines[0])
        except Exception:
            pass
        prediction_value=sess.run(prediction,feed_dict={xs:x_data})
        #plot the prediction
        #画一条曲线,红色,宽度为5
        lines=ax.plot(x_data,prediction_value,'r-',lw=5)
        plt.pause(0.1)#让线条停顿0.1秒

#让画图框运行完不会消失
plt.ioff()
plt.show()
学自 莫烦 PYTHON


