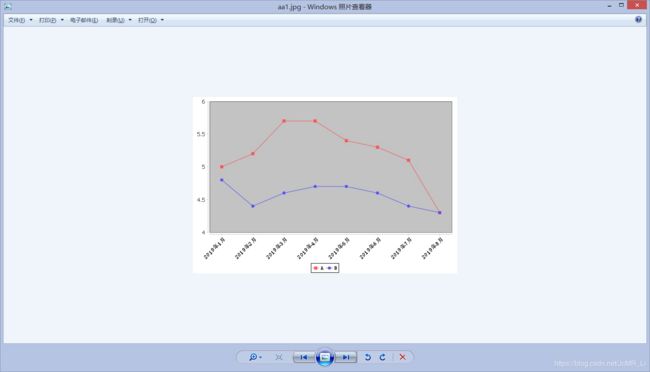
JFreeChart工具类(创建折线图)
JFreeChartUtil创建折线图
ps:目前仅实现折线图创建
(文件路径设置为C盘可能导致无法访问)
maven依赖:
     org.jfree
     jfreechart
     1.0.19


     org.jfree
     jcommon
     1.0.23
JFreeChartUtil
package common;

import org.apache.commons.lang.StringUtils;
import org.jfree.chart.ChartFactory;
import org.jfree.chart.ChartUtilities;
import org.jfree.chart.JFreeChart;
import org.jfree.chart.axis.*;
import org.jfree.chart.labels.StandardCategoryItemLabelGenerator;
import org.jfree.chart.plot.CategoryPlot;
import org.jfree.chart.plot.PlotOrientation;
import org.jfree.chart.renderer.category.LineAndShapeRenderer;
import org.jfree.chart.title.TextTitle;
import org.jfree.data.category.CategoryDataset;
import org.jfree.data.general.DatasetUtilities;

import java.awt.*;
import java.io.File;
import java.io.FileOutputStream;

/**
 * @program: Demo
 * @Date: 2019/2/20 20:05
 * @Author: LiJc
 * @Description:
 */
public class JFreeChartUtil {

    private String imgpath;

    public String getImgpath() {
        if(StringUtils.isEmpty(imgpath)){
            return "D:\\";
        }
        return imgpath;
    }

    public void setImgpath(String imgpath) {
        this.imgpath = imgpath;
    }

    /**
     * 创建简单折线图
     * @param rowKeys
     * @param colKeys
     * @param data
     * @param charName
     * @return
     */
    public String createTimeXYCharSimple(String[] rowKeys, String[] colKeys, double[][] data, String charName){
        CategoryDataset xyDataset = DatasetUtilities.createCategoryDataset(rowKeys, colKeys, data);
        return createTimeXYChar("", "", "", xyDataset, charName, false, 0, 0, 1);
    }

    /**
     * 创建简单折线图(设置刻度)
     * @param rowKeys
     * @param colKeys
     * @param data
     * @param charName
     * @param min	刻度最小值
     * @param max	刻度最大值
     * @param size	刻度间隔
     * @return
     */
    public String createTimeXYCharSimpleSetBoundAndTick(String[] rowKeys, String[] colKeys, double[][] data, String charName, double min, double max, double size){
        CategoryDataset xyDataset = DatasetUtilities.createCategoryDataset(rowKeys, colKeys, data);
        return createTimeXYChar("", "", "", xyDataset, charName, true, min, max, size);
    }

    /**
     * 折线图
     *
     * @param chartTitle
     * @param x
     * @param y
     * @param xyDataset
     * @param charName
     * @param min	刻度最小值
     * @param max	刻度最大值
     * @param size	刻度间隔
     * @return
     */
    public String createTimeXYChar(String chartTitle, String x, String y, CategoryDataset xyDataset, String charName, boolean flag, double min, double max, double size) {

        //ChartFactory.createLineChart3D创建3D折线图
        JFreeChart chart = ChartFactory.createLineChart(chartTitle, //标题
                x, //x轴标签
                y, //y轴标签
                xyDataset, //数据源
                PlotOrientation.VERTICAL, //图表方向:水平、垂直
                true, //是否显示图例(对于简单的柱状图必须是false)
                true, //是否生成工具
                false); //是否生成URL链接

        //字体
        Font titlefont = new Font("宋体", Font.BOLD, 25);
        Font labelFont = new Font("宋体", Font.CENTER_BASELINE, 12);

        chart.setTextAntiAlias(false);
        // 设置背景色
        chart.setBackgroundPaint(Color.WHITE);
        // 重设标题
        TextTitle title = new TextTitle(chartTitle);
        title.setFont(titlefont);
        chart.setTitle(title);
        // 设置选项字体
        chart.getLegend().setItemFont(labelFont);

        //获取图表主体
        CategoryPlot categoryplot = (CategoryPlot) chart.getPlot();

        // x轴
        categoryplot.setDomainGridlinesVisible(false);//设置网格是否可见
        categoryplot.setDomainGridlinePaint(Color.WHITE);// 虚线色彩
        // y轴
        categoryplot.setRangeGridlinesVisible(false);//设置网格是否可见
        categoryplot.setRangeGridlinePaint(Color.WHITE);// 虚线色彩

        categoryplot.setBackgroundPaint(Color.lightGray);//图表背景色

        // 设置轴和面板之间的距离
        // categoryplot.setAxisOffset(new RectangleInsets(5D, 5D, 5D, 5D));

        // x轴
        CategoryAxis domainAxis = categoryplot.getDomainAxis();
        domainAxis.setLabelFont(labelFont);// 轴标题字体
        domainAxis.setTickLabelFont(labelFont);// 轴数值字体
        domainAxis.setCategoryLabelPositions(CategoryLabelPositions.UP_45); // 轴标题45度倾斜
        // y轴
        ValueAxis valueAxis = categoryplot.getRangeAxis();
        valueAxis.setLabelFont(labelFont);// 轴标题字体
        if(flag){
            valueAxis.setLowerBound(min);
            valueAxis.setUpperBound(max);
        }
        NumberAxis numAxis = (NumberAxis) categoryplot.getRangeAxis();
        numAxis.setTickUnit(new NumberTickUnit(size));//设置Y轴间隔


        // 设置距离图片左端距离
        domainAxis.setLowerMargin(0.0);
        // 设置距离图片右端距离
        domainAxis.setUpperMargin(0.0);

        NumberAxis numberaxis = (NumberAxis) categoryplot.getRangeAxis();
        numberaxis.setStandardTickUnits(NumberAxis.createIntegerTickUnits());
        numberaxis.setAutoRangeIncludesZero(true);

        LineAndShapeRenderer lineandshaperenderer = (LineAndShapeRenderer) categoryplot.getRenderer();
        lineandshaperenderer.setBaseShapesVisible(true); // series 点(即数据点)可见
        lineandshaperenderer.setBaseLinesVisible(true); // series 点(即数据点)间有连线可见

        // 显示折点数据
        lineandshaperenderer.setBaseItemLabelGenerator(new StandardCategoryItemLabelGenerator());
        lineandshaperenderer.setBaseItemLabelsVisible(false);

        FileOutputStream fos_jpg = null;
        try {
            isChartPathExist(getImgpath());
            String chartName = getImgpath() + charName;
            fos_jpg = new FileOutputStream(chartName);

            // 将报表保存为jpeg文件
            ChartUtilities.writeChartAsJPEG(fos_jpg, chart, 600, 400);

            return chartName;
        } catch (Exception e) {
            e.printStackTrace();
            return null;
        } finally {
            try {
                fos_jpg.close();
            } catch (Exception e) {
                e.printStackTrace();
            }
        }
    }

    /**
     * 判断文件夹是否存在,如果不存在则新建
     * @param chartPath
     */
    public void isChartPathExist(String chartPath) {
        File file = new File(chartPath);
        if (!file.exists()) {
            file.mkdirs();
        }
    }
}
单元测试:
package common;

import org.junit.Test;

/**
 * @program: Demo
 * @Date: 2019/2/20 20:10
 * @Author: LiJc
 * @Description:
 */
public class JFreeChartTest {

    /**
     * 创建折线图
     */
    @Test
    public void test1(){
        JFreeChartUtil chartUtil = new JFreeChartUtil();
        double[][] data = new double[][] { { 5, 5.2, 5.7, 5.7, 5.4, 5.3, 5.1, 4.3 },
                { 4.8, 4.4, 4.6, 4.7, 4.7, 4.6, 4.4, 4.3 } };
        String[] rowKeys = { "A", "B"};
        String[] colKeys = { "2019年1月", "2019年2月", "2019年3月", "2019年4月", "2019年5月", "2019年6月", "2019年7月", "2019年8月" };
        chartUtil.createTimeXYCharSimple(rowKeys, colKeys, data, "aa.jpg");
    }

    /**
     * 创建折线图(设置刻度)
     */
    @Test
    public void test2(){
        JFreeChartUtil chartUtil = new JFreeChartUtil();
        double[][] data = new double[][] { { 5, 5.2, 5.7, 5.7, 5.4, 5.3, 5.1, 4.3},
                { 4.8, 4.4, 4.6, 4.7, 4.7, 4.6, 4.4, 4.3} };
        String[] rowKeys = { "A", "B"};
        String[] colKeys = { "2019年1月", "2019年2月", "2019年3月", "2019年4月", "2019年5月", "2019年6月", "2019年7月", "2019年8月" };
        chartUtil.createTimeXYCharSimpleSetBoundAndTick(rowKeys, colKeys, data, "aa1.jpg", 4, 6, 0.5);
    }
}
代码已上传github:https://github.com/MrJcL/Demo.git

