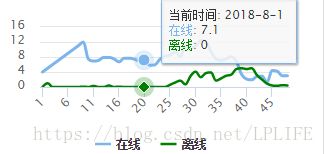
highchart提示框获取正确时间并同时给出所有图的点值
this.ACSOption = {

chart: {

type: 'spline'

},

title: {

align: 'left',

text: '近24小时'

},

legend: {

enabled: true

},

yAxis: {

title: {

text: ''

},

lineWidth: 0,

tickInterval: 1,

tickPixelInterval: 0,

},

xAxis: {

type: 'datetime',

tickPixelInterval: 20,

dateTimeLabelFormats: {

day: '%b/%e',

month: '%y年%b月',

week: '%b/%e',

year: '%Y年',

millisecond: '%b/%e',

},

categories: [1, 2, 3, 4, 5, 6, 7, 8, 9, 10, 11, 12, 13, 14, 15, 16]

},

credits: {

enabled: false

},

tooltip: {

shared: true,

formatter : function() {

var date = new Date();

var content = '当前时间: ' + date.getFullYear() + '-' + (date.getMonth() + 1) + '-' + date.getDate() + ' '+ '
';

for (var i = 0; i < this.points.length; i++) {

content += '' + this.points[i].series.name + ': ' + this.points[i].y + '
';

};

content += ''

return content;

}


},

plotOptions: {

spline: {

lineWidth: 2.5,

states: {

hover: {

lineWidth: 3

}

},

marker: {

enabled: false

},


}

},


series: [{

name: '在线',

data: [4, 5, 6, 7, 8, 9, 10, 11, 12, 7.4, 6.9, 7.1,

7.9, 7.9, 7.5, 6.7, 7.7, 7.7, 7.4, 7.0, 7.1, 5.8, 5.9, 7.4,

8.2, 8.5, 9.4, 8.1, 10.9, 10.4, 10.9, 12.4, 12.1, 9.5, 7.5,

7.1, 7.5, 8.1, 6.8, 3.4, 2.1, 1.9, 2.8, 2.9, 1.3, 4.4, 4.2,

3.0, 3.0]

}, {

name: '离线',

data: [0.0, 1.0, 0.0, 0.0, 0.0, 0.0, 0.0, 0.0, 0.1, 0.0, 0.3, 0.0,

0.0, 0.4, 0.0, 0.1, 0.0, 0.0, 0.0, 0.0, 0.0, 0.0, 0.0, 0.0,

0.0, 0.6, 1.2, 1.7, 0.7, 2.9, 4.1, 2.6, 3.7, 3.9, 1.7, 2.3,

3.0, 3.3, 4.8, 5.0, 4.8, 5.0, 3.2, 2.0, 0.9, 0.4, 0.3, 0.5, 0.4],

color: 'green'

}]


};
如下图:
