Matplotlib绘图(二)
这篇博文对图像的设置命令进行详细解析
首先有以下常用的图像设置命令:
| 命令 | 含义 |
|---|---|
| plt.title() | 设置图像标题 |
| plt.xlim() | 设置x轴显示范围 |
| plt.ylim() | 设置y轴显示范围 |
| plt.xlabel() | 设置x轴标题 |
| plt.ylabel() | 设置y轴标题 |
| plt.axhline() | 绘制平行于x轴的水平参考线 |
| plt.axvline() | 绘制平行于y轴的水平参考线 |
| plt.axvspan() | 绘制垂直于x轴的参考区域 |
| plt.axhspan() | 绘制垂直于y轴的参考区域 |
| plt.legend() | 标示不同图形的文本标签图例 |
| plt.xticks() | 设置x轴的标签名称 |
| plt.yticks() | 设置y轴的标签名称 |
| plt.text() | 添加图形内容细节的无指向型注释文本 |
| plt.annotate() | 添加图形内容细节的指向型注释文本 |
目录
- title()
- xlim() & ylim()
- xlabel() & ylabel()
- grid()
- axhline() & axvline()
- axhspan() & axvspan()
- legend()
- xticks() & yticks()
- text()
- annotate()
title()
x = np.linspace(1,10,20)
y = np.sin(x)

plt.plot(x,y)
plt.title("我的matplotlib图")
plt.show()
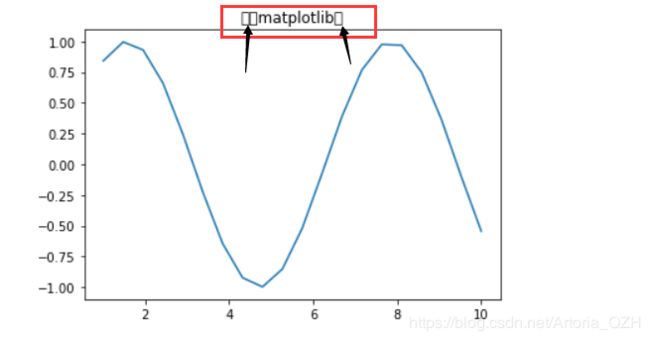
plt.rcParams['font.sans-serif']=['SimHei']         # 用来正常显示中文标签
plt.rcParams['axes.unicode_minus']=False           # 用来正常显示负号
xlim() & ylim()
x = np.linspace(1,10,20)
y = np.sin(x)

plt.plot(x,y)
plt.title("我的matplotlib图")
plt.xlim(2,6)                             #   x取2到6
plt.ylim(0,1)                             #   y取0到1
plt.show()
xlabel() & ylabel()
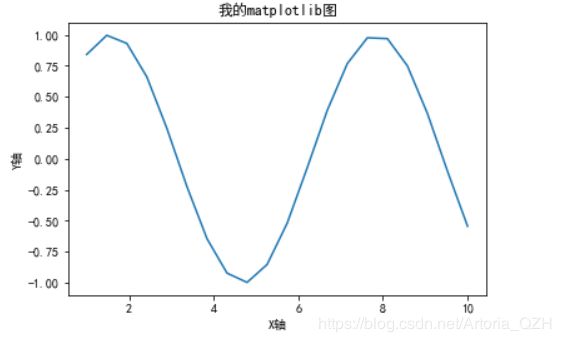
x = np.linspace(1,10,20)
y = np.sin(x)

plt.plot(x,y)
plt.title("我的matplotlib图")
plt.xlabel('X轴')
plt.ylabel('Y轴')
plt.show()
grid()
grid()为网格线,参数实际十分多,在此只列举其中几个常用的。
matplotlin.pyplot.grid(axis, color, linestyle, linewidth, **kwargs)
- axis : 取值为‘both’, ‘x’,‘y’。若输入的为x或y,怎对应隐藏平行于x轴或y轴的那条线。
- color : 这就不用多说了,就是设置网格线的颜色。或者直接用
c来代替color也可以。 - linestyle :也可以用
ls来代替linestyle, 设置网格线的风格,是连续实线,虚线或者其它不同的线条。 - linewidth:网格线的宽度。
x = np.linspace(1,10,20)
y = np.sin(x)

plt.plot(x,y)
plt.title("我的matplotlib图")
plt.grid(c='b')
plt.show()
x = np.linspace(1,10,20)
y = np.sin(x)

plt.plot(x,y)
plt.title("我的matplotlib图")
plt.grid(linestyle = '-.')
plt.show()
x = np.linspace(1,10,20)
y = np.sin(x)

plt.plot(x,y)
plt.title("我的matplotlib图")
plt.grid(linestyle = '-.',linewidth=5)
plt.show()
axhline() & axvline()
axhline(y=0, xmin=0, xmax=1, **kwargs)
axvline(x=0, ymin=1, ymax=1, **kwargs)
axhline为绘制平行于x轴的参考线,axvline为绘制平行于y州的参考线。两者的参数含义基本一致,下面以axhline为例
- y
y是参考线的位置,默认为y= 0
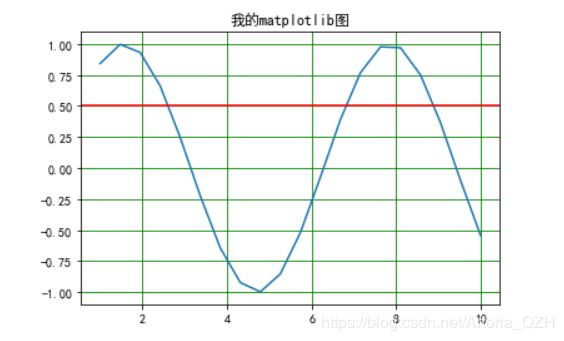
x = np.linspace(1,10,20)
y = np.sin(x)

plt.plot(x,y)
plt.title("我的matplotlib图")
plt.grid(c='g')
plt.axhline(y= 0.5,color = 'r')
plt.show()
- xmin & xmax
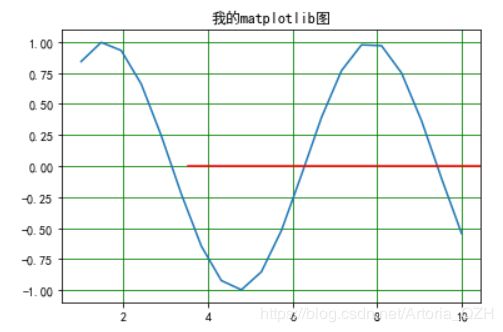
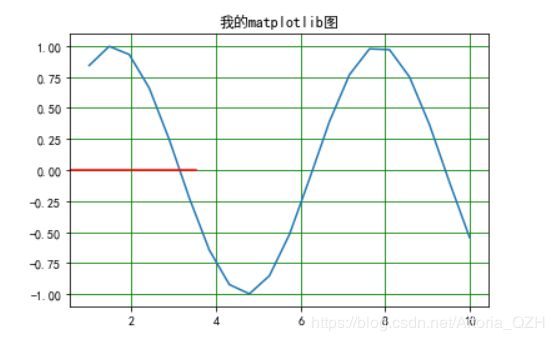
xmin和xmax分别对应起始和终止位置,且值域均为0~1
x = np.linspace(1,10,20)
y = np.sin(x)

plt.plot(x,y)
plt.title("我的matplotlib图")
plt.grid(c='g')
plt.axhline(xmin = 0.3,color = 'r')
plt.show()
x = np.linspace(1,10,20)
y = np.sin(x)

plt.plot(x,y)
plt.title("我的matplotlib图")
plt.grid(c='g')
plt.axhline(xmax = 0.3,color = 'r')
plt.show()
axhspan() & axvspan()
axhspan(ymin, ymax, xmin=0, xmax=1, **kwargs)
axhspan(xmin, xmax, ymin=0, ymax=1, **kwargs)
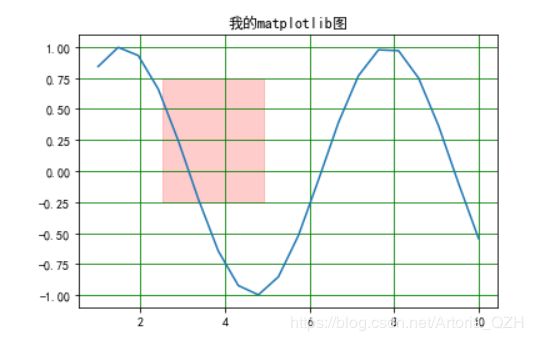
axhspan和axvspan可以理解为由线变为面
x = np.linspace(1,10,20)
y = np.sin(x)

plt.plot(x,y)
plt.title("我的matplotlib图")
plt.grid(c='g')
plt.axhspan(ymin = -0.25, ymax = 0.75 ,xmin = 0.2, xmax = 0.44, color = 'r', alpha = 0.2)
# alpha为透明度
plt.show()
legend()
legend为标示不同图形的文本标签图例。
| Keyword | Description |
|---|---|
| loc | Location code string, or tuple (see below) |
| fontsize | the font size (used only if prop is not specified) |
| prop | the font property |
| markerscale | the relative size of legend markers vs. original |
| markerfirst | If True (default), marker is to left of the label |
| numpoints | the number of points in the legend for line |
| scatterpoints | he number of points in the legend for scatter plot |
| scatteroffsets | a list of yoffsets for scatter symbols in legend |
| frameon | If True, draw the legend on a patch (frame) |
| shadow | If True, draw a shadow behind legend |
| framealpha | Transparency of the frame |
| edgecolor | Frame edgecolor |
| facecolor | Frame facecolor |
| fancybox | If True, draw the frame with a round fancybox |
| ncol | number of columns |
| borderpad | the fractional whitespace inside the legend border |
| handlelength | the length of the legend hendles |
| handletextpad | The pad between the legend handle and text |
| borderaxespad | the pad between the axes and legend border |
| columnspacing | the spacing between columns |
| title | the legend title |
| bbox_to_anchor | the bbox that the legend will be anchored |
| bbox_tansform | the transform for the bbox,transAxes if None |
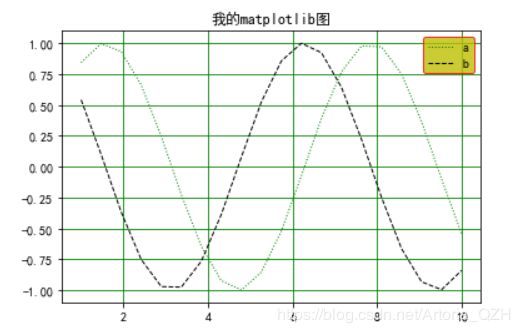
可以看到lengend也有很多参数,在这主要介绍loc、edgecolor和facecolor。
- loc
loc是图例的位置,支持整数和字符串。有以下可选参数:
| str | int |
|---|---|
| ‘best’ | 0 |
| ‘upper right’ | 1 |
| ‘upper left’ | 2 |
| ‘lower left’ | 3 |
| ‘lower right’ | 4 |
| ‘right’ | 5 |
| ‘center left’ | 6 |
| ‘center right’ | 7 |
| ‘lower center’ | 8 |
| ‘upper center’ | 9 |
| ‘center’ | 10 |
-
edgecolor
edgecolor是图例外框颜色 -
facecolor
facecolor是图例框内填充颜色
x = np.linspace(1,10,20)
y1 = np.sin(x)
y2 = np.cos(x)

l1, = plt.plot(x, y1, c='g', linewidth = 1.0, linestyle = ':')          # 逗号不能省略
l2, = plt.plot(x, y2, c='k', linewidth = 1.0, linestyle = '--')         # 逗号不能省略
plt.title("我的matplotlib图")
plt.grid(c='g')
plt.legend(handles = [l1, l2,], labels = ['a', 'b'], loc = 'best', edgecolor = 'r', facecolor = 'y')
plt.show()
xticks() & yticks()
xticks和yticks分别对应x轴标签和y轴标签
x = np.linspace(1,10,20)
y1 = np.sin(x)
y2 = np.cos(x)

l1, = plt.plot(x, y1, c='g', linewidth = 1.0, linestyle = '-')          # 逗号不能省略
l2, = plt.plot(x, y2, c='k', linewidth = 1.0, linestyle = '--')         # 逗号不能省略
plt.title("我的matplotlib图")
plt.grid(linestyle=':')
labels=['a', 'e', 'i', 'o', 'u']
plt.xticks(x, labels)
plt.show()
text()
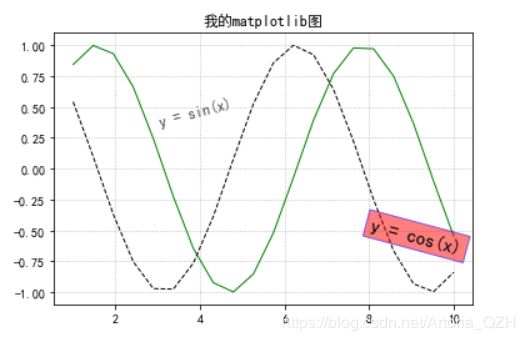
text是添加图形内容细节的无指向型注释文本。
plt.text(x,y,string,fontsize,verticalalignment,horizontalalignment,kwargs**)
- x,y:表示坐标值上的值
- string:表示说明文字
- size:表示字体大小
- verticalalignment:垂直对齐方式 ,参数:(‘center’ | ‘top’ | ‘bottom’ | ‘baseline’ )
- horizontalalignment:水平对齐方式 ,参数:( ‘center’ | ‘right’ | ‘left’ )
除了这几个,还有个参数bbox需要注意:
bbox给标题增加外框 ,bbox(boxstyle, facecolor, edgecolor)
接下来看个实例:
x = np.linspace(1,10,20)
y1 = np.sin(x)
y2 = np.cos(x)

l1, = plt.plot(x, y1, c='g', linewidth = 1.0, linestyle = '-')          # 逗号不能省略
l2, = plt.plot(x, y2, c='k', linewidth = 1.0, linestyle = '--')         # 逗号不能省略
plt.title("我的matplotlib图")
plt.text(3, 0.5, "y = sin(x)", size = 12, alpha = 0.7, rotation = 15)
plt.text(8, -0.5, "y = cos(x)", size = 15, \
         rotation = -15, bbox = dict(facecolor = "r",edgecolor = 'b',\
                                                                       alpha = 0.5))
plt.grid(linestyle=':')
plt.show()
annotate()
annotate是添加图形内容细节的指向型注释文本。
在这里推荐一篇介绍的非常详细博文,对annotate各种应用都进行了介绍
annotate(str,xy,*args,kwargs**)
- s:注释文本的内容
- xy:被注释的坐标点,二维元组形如(x,y)
- xytext:注释文本的坐标点,也是二维元组,默认与xy相同
- xycoords:被注释点的坐标系属性
- textcoords :注释文本的坐标系属性,默认与xycoords属性值相同,也可设为不同的值。
- arrowprops:箭头的样式,dict(字典)型数据,如果该属性非空,则会在注释文本和被注释点之间画一个箭头。
x = np.linspace(1,10,20)
y1 = np.sin(x)

l1, = plt.plot(x, y1, c='b', linewidth = 1.0, linestyle = ':')          # 逗号不能省略
plt.title("我的matplotlib图")

plt.plot([6], [-0.25], 'ro')
plt.annotate("Function is sin(x)",xy=(6,-0.25), xytext=(7,-0.5), \
            arrowprops = dict(facecolor = "y", headlength = 10, headwidth = 20, width = 10, alpha = 0.3))
# 指出最小值
plt.plot([4.8], [-1], 'ro')
plt.annotate("最小值", xy=(4.8,-1), xytext=(2,-0.75), \
            arrowprops = dict(facecolor = "teal", headlength = 15, headwidth = 25, width = 10, alpha = 0.3),\
            bbox=dict(boxstyle='round,pad=0.5', fc='yellow', ec='k',alpha=0.2))

plt.grid(linestyle=':')
plt.show()
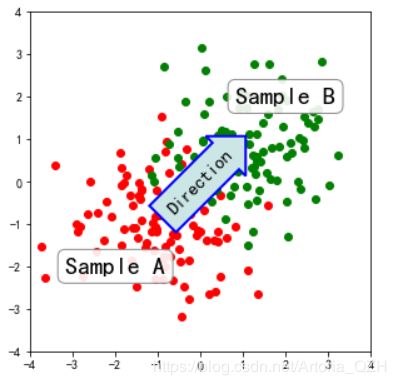
注释也可以放在箭头内部:
import numpy as np
import matplotlib.pyplot as plt

fig, ax = plt.subplots(figsize=(5, 5))
ax.set_aspect(1)

x1 = -1 + np.random.randn(100)
y1 = -1 + np.random.randn(100)
x2 = 1. + np.random.randn(100)
y2 = 1. + np.random.randn(100)

ax.scatter(x1, y1, color="r")
ax.scatter(x2, y2, color="g")

bbox_props = dict(boxstyle="round", fc="w", ec="0.5", alpha=0.9)
ax.text(-2, -2, "Sample A", ha="center", va="center", size=20,
    bbox=bbox_props)
ax.text(2, 2, "Sample B", ha="center", va="center", size=20,
    bbox=bbox_props)


bbox_props = dict(boxstyle="rarrow", fc=(0.8, 0.9, 0.9), ec="b", lw=2)
t = ax.text(0, 0, "Direction", ha="center", va="center", rotation=45,
      size=15,
      bbox=bbox_props)

bb = t.get_bbox_patch()
bb.set_boxstyle("rarrow", pad=0.6)

ax.set_xlim(-4, 4)
ax.set_ylim(-4, 4)

plt.show()
