微信小程序-wx-charts 图表插件
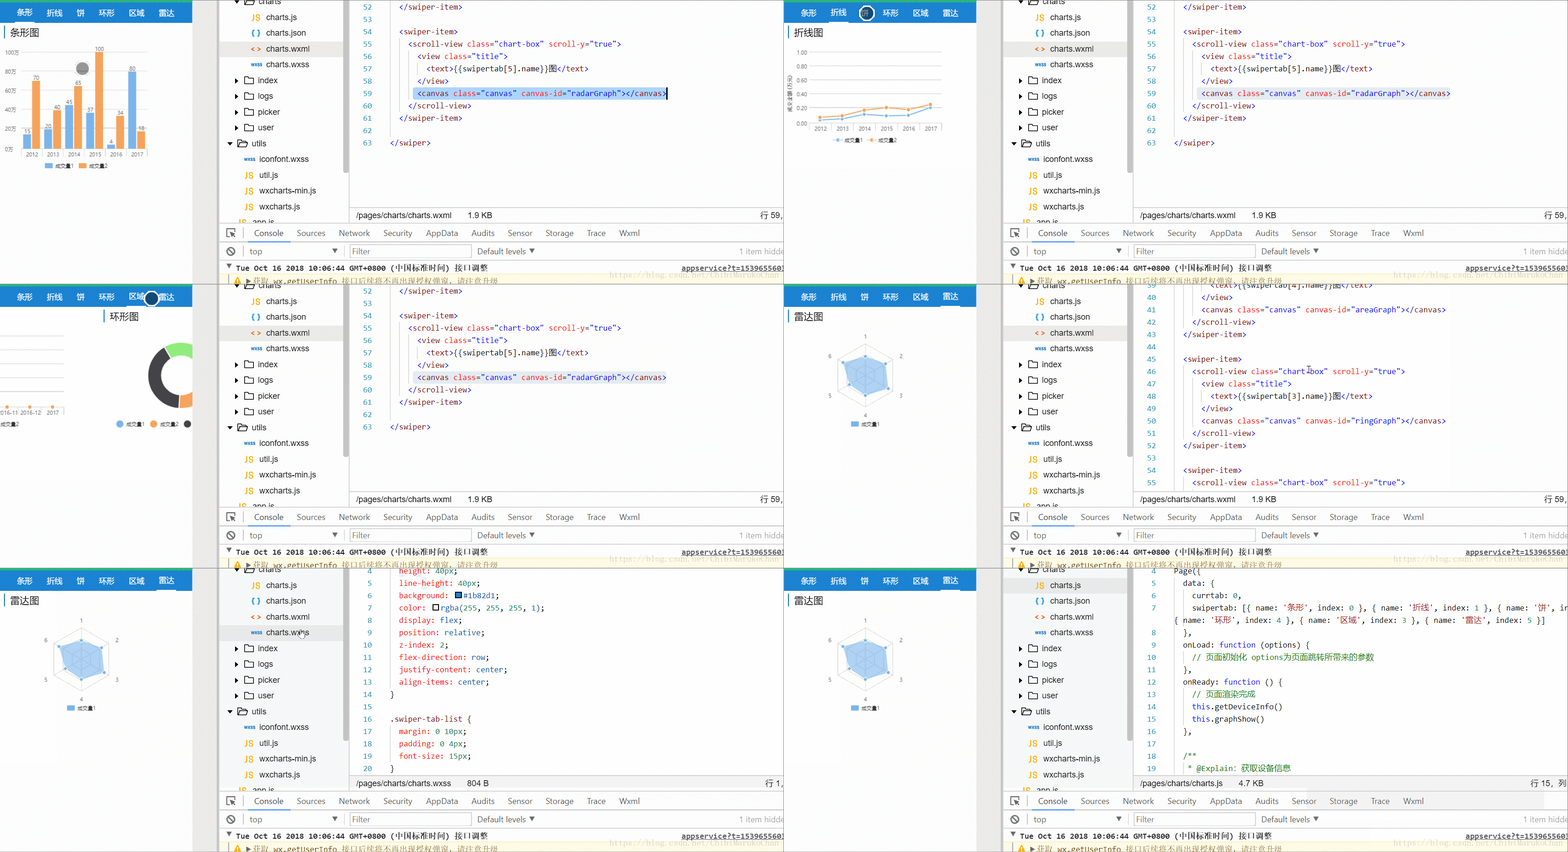
微信小程序图表插件(wx-charts)基于canvas绘制,体积小巧,支持图表类型饼图、线图、柱状图 、区域图等图表图形绘制。
支持图标类型
- 饼图 pie
- 圆环图 ring
- 线图 line
- 柱状图 column
- 区域图 area
- 雷达图 radar
1.如何使用?
下载wxcharts-min.js或者wxcharts.js,存放在小程序文件夹目录,我一般存放在utils文件夹下面
.wxml页面中:
2.部分参数说明
| 参数 | 说明 |
| opts.canvasId | 微信小程序canvas-id |
| opts.width | canvas宽度,单位为px |
| opts.height | canvas高度,单位为px |
| opts.title | (only for ring chart) |
| opts.title.name | 标题内容 |
| opts.title.fontSize | 标题字体大小 |
| opts.title.color | 标题颜色可选 |
| opts.legend | 是否显示图标下方的标识 |
| opts.type | 图表类型:pie,line,column,area,ring |
| opts.categories | (饼图、圆环图不需要) 数据类别分类 |
| opts.dataLabel | 是否在图表中显示数据内容值 |
| opts.dataPointShape | 是否在图表中显示数据点标识 |
| opts.xAxis | X轴配置 |
| opts.yAxis | Y轴配置 |
3.简单的示例
wxml页面:
    {{item.name}}


        {{swipertab[0].name}}图


        {{swipertab[1].name}}图


        {{swipertab[2].name}}图


        {{swipertab[4].name}}图


        {{swipertab[3].name}}图


        {{swipertab[5].name}}图
对应的wxss中:
/* pages/charts/charts.wxss */

.swiper-tab {
  height: 40px;
  line-height: 40px;
  background: #1b82d1;
  color: rgba(255, 255, 255, 1);
  display: flex;
  position: relative;
  z-index: 2;
  flex-direction: row;
  justify-content: center;
  align-items: center;
}

.swiper-tab-list {
  margin: 0 10px;
  padding: 0 4px;
  font-size: 15px;
}

.on {
  border-bottom:3px solid #fff;
  color: #fff;
}

.title {
  padding: 10rpx 0 10rpx 20rpx;
  background-color: #fff;
}

.title text {
  border-left: 2px solid #1b82d1;
  padding-left: 20rpx;
}

.swiper-box {
  display: block;
  height: 100%;
  width: 100%;
  overflow: hidden;
}

swiper-item scroll-view {
  height: 100%;
}

scroll-view .canvas {
  width: 100%;
  height: 100%;
  margin-top: 20rpx;
}
对应的js中:
var _wxcharts = require('../../utils/wxcharts.js')

Page({
  data: {
    currtab: 0,
    swipertab: [{ name: '条形', index: 0 }, { name: '折线', index: 1 }, { name: '饼', index: 2 }, { name: '环形', index: 4 }, { name: '区域', index: 3 }, { name: '雷达', index: 5 }]
  },
  onLoad: function (options) {
    // 页面初始化 options为页面跳转所带来的参数
  },
  onReady: function () {
    // 页面渲染完成
    this.getDeviceInfo()
    this.graphShow()
  },

  /**
   * @Explain:获取设备信息
   */
  getDeviceInfo: function () {
    let that = this
    wx.getSystemInfo({
      success: function (res) {
        that.setData({
          deviceW: res.windowWidth,
          deviceH: res.windowHeight
        })
      }
    })
  },

  /**
   * @Explain:选项卡切换
   */
  tabChange: function (e) {
    this.setData({ currtab: e.detail.current })
    this.graphShow()
  },

  /**
   * @Explain:选项卡点击切换
   */
  tabSwitch: function (e) {
    var that = this
    if (this.data.currtab === e.target.dataset.current) {
      return false
    } else {
      that.setData({
        currtab: e.target.dataset.current
      })
    }
  },

  /**
   * @Explain:初始化静态图表
   */
  graphShow: function () {
    let that = this
    switch (this.data.currtab) {
      case 0:
        that.barShow()
        break
      case 1:
        that.lineShow()
        break
      case 2:
        that.pieShow()
        break
      case 3:
        that.areaShow()
        break
      case 4:
        that.ringShow()
        break
      case 5:
        that.radarShow()
        break
    }
  },

  pieShow: function () {
    let pie = {
      canvasId: 'pieGraph',
      type: 'pie',
      series: [{
        name: 'cat1',
        data: 50,
      }, {
        name: 'cat2',
        data: 30,
      }, {
        name: 'cat3',
        data: 1,
      }, {
        name: 'cat4',
        data: 1,
      }, {
        name: 'cat5',
        data: 46,
      }],
      width: 360,
      height: 300,
      dataLabel: true
    }
    new _wxcharts(pie)
  },

  barShow: function () {
    let bar = {
      canvasId: 'barGraph',
      type: 'column',
      categories: ['2012', '2013', '2014', '2015', '2016', '2017'],
      series: [{
        name: '成交量1',
        data: [15, 20, 45, 37, 4, 80]
      }, {
        name: '成交量2',
        data: [70, 40, 65, 100, 34, 18]
      }],
      yAxis: {
        format: function (val) {
          return val + '万';
        }
      },
      width: 300,
      height:250
    }
    new _wxcharts(bar)
  },

  lineShow: function () {
    let line = {
      canvasId: 'lineGraph',

      type: 'line',
      categories: ['2012', '2013', '2014', '2015', '2016', '2017'],
      series: [{
        name: '成交量1',
        data: [0.15, 0.2, 0.45, 0.37, 0.4, 0.8],
        format: function (val) {
          return val.toFixed(2) + '万';
        }
      }, {
        name: '成交量2',
        data: [0.30, 0.37, 0.65, 0.78, 0.69, 0.94],
        format: function (val) {
          return val.toFixed(2) + '万';
        }
      }],
      yAxis: {
        title: '成交金额 (万元)',
        format: function (val) {
          return val.toFixed(2);
        },
        min: 0
      },
      width: 320,
      height: 200
    }
    new _wxcharts(line)
  },

  ringShow: function() {
    let ring={
      canvasId: 'ringGraph',
      type: 'ring',
      series: [{
        name: '成交量1',
        data: 15,
      }, {
        name: '成交量2',
        data: 35,
      }, {
        name: '成交量3',
        data: 78,
      }, {
        name: '成交量4',
        data: 63,
      }],
      width: 320,
      height: 200,
      dataLabel: false
    }
    new _wxcharts(ring)
  },

  areaShow: function () {
    let area = {
      canvasId: 'areaGraph',
      type: 'area',
      categories: ['2016-08', '2016-09', '2016-10', '2016-11', '2016-12', '2017'],
      series: [{
        name: '成交量1',
        data: [70, 40, 65, 100, 34, 18],
        format: function (val) {
          return val.toFixed(2) + '万';
        }
      }, {
        name: '成交量2',
        data: [15, 20, 45, 37, 4, 80],
        format: function (val) {
          return val.toFixed(2) + '万';
        }
      }],
      yAxis: {
        format: function (val) {
          return val + '万';
        }
      },
      width: 320,
      height: 200
    }
    new _wxcharts(area)
  },

  radarShow: function () {
    let radar={
      canvasId: 'radarGraph',
      type: 'radar',
      categories: ['1', '2', '3', '4', '5', '6'],
      series: [{
        name: '成交量1',
        data: [90, 110, 125, 95, 87, 122]
      }],
      width: 320,
      height: 200,
      extra: {
        radar: {
          max: 150
        }
      }
    }
    new _wxcharts(radar)

  }

})
