x-pack 介绍
elk 的系统组件 x-pack 一个集安全、警报、监视、报告和图形功能于身的扩展,轻松开启或关闭那你想要的功能。
效果图
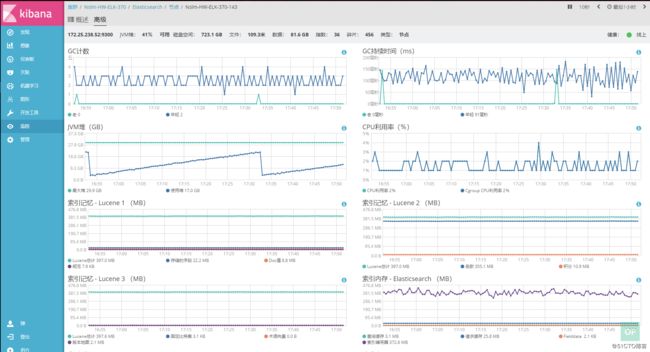
1.监控概览

2.elasticserch监控图
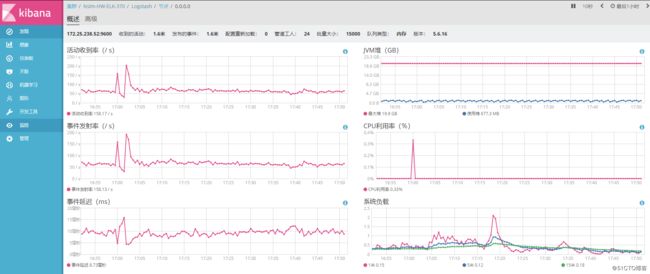
3.logstash监控图
1.配置介绍
                Centos 6.4
                logstash-5.6.4-1.noarch
                elasticsearch-5.6.4-1.noarch
                kibana-5.6.4-1.x86_64
2.yum源配置
            1. 安装key
                rpm --import https://packages.elastic.co/GPG-KEY-elasticsearch
            2.添加/etc/yum.repos.d/elastic.repo
                [elastic-5.x]
                name=Elastic repository for 5.x packages
                baseurl=https://artifacts.elastic.co/packages/5.x/yum
                gpgcheck=1
                gpgkey=https://artifacts.elastic.co/GPG-KEY-elasticsearch
                enabled=1
                autorefresh=1
                type=rpm-md
3.安装logstash
            1. yum install logstash-5.6.4-1.noarch
            2. 目录介绍
                    logstash 跟目录  /usr/share/logstash/
                    配置文件目录在  /etc/logstash/
                    数据目录             /var/lib/logstash/
            3. 安装logstash的x-pack扩展
                    cd /usr/share/logstash/bin/  &&  ./logstash-plugin  install x-pack
            4.修改配置文件/etc/logstash/logstash.yml
                    pipeline.batch.size: 5000                                #在发送给过滤器+工作人员之前,从输入中检索多少事件
                    pipeline.batch.delay: 30                                   #不足125个时间批量发送等待时间,值以毫秒为单位
                    pipeline.workers: 24                                         #过滤器并行数量
                    pipeline.output.workers: 24                              #输出程序的并行进程数量
                    path.config: /etc/logstash/conf.d                       #配置文件目录
                    http.host: "10.0.0.1"                                          #监听地址
                    http.port: 9600                                                  #监听端口
                    log.level: info                                                    #日志级别
                    path.logs: /var/log/logstash                               #日志目录
                    path.data: /var/lib/logstash                               #数据目录
                    #xpack.monitoring.enabled: false                    #是否关闭logstash x-pack监控
                    xpack.monitoring.elasticsearch.url: "http://10.16.26.31:9200"      #监控数据写入地址
                    xpack.monitoring.elasticsearch.username: "logstash_system"     #链接es的账户 此用户和密码是es安装x-pack之后默认生成
                    xpack.monitoring.elasticsearch.password: "changeme"               #链接es的密码
                5.如果logstahs的数据处理配置文件output是输入到es需要添加用户名密码,密码需要在kibana dev创建
                    output {
                        if [type] =~ "reslog|itemlog" {
                            elasticsearch {
                            user => "logstash_internal"
                            password => "changeme"
                            id => "nslm3-%{[type]}"
                            hosts => ["10.0.0.1:9200"]
                            index => "logstash-nslm3-%{[type]}-%{+YYYY.MM}"
                            template => "/etc/logstash/template/index_template.json"
                            template_name => "nslm3"
                            #template_overwrite => true
                        }
                    }
                    #stdout { codec => rubydebug }
                }
3.安装elasticsearch
                1.yum install elasticsearch-5.6.4-1.noarch
                2.目录介绍
                    elasticsearch 跟目录  /usr/share/elasticsearch/
                    配置文件目录在  /etc/elasticsearch/
                    数据目录             /var/lib/elasticsearch/
                3.x-pack扩展安装
                    cd /usr/share/elasticsearch/bin/  &&  ./elasticsearch-plugin  install x-pack
                    过程中需要输入y确认
                4.修改配置文件/etc/elasticsearch/elasticsearch.yml
                    cluster.name: Elk                         #集群名
                    node.name: Elk-31                      #节点名
                    path.data: /data/elasticsearch/data             #数据目录
                    path.logs: /data/elasticsearch/logs             #日志目录
                    bootstrap.memory_lock: false                     #关闭内存所
                    bootstrap.system_call_filter: false
                    network.host: 10.0.0.1
                    http.port: 9200
                    #多线程配置
                    thread_pool.index.size: 24              #线程池大小(建议2~3倍cpu数)
                    thread_pool.index.queue_size: 10000      #队列大小
                    thread_pool.search.size: 36             #搜索线程池大小
                    thread_pool.search.queue_size: 10000     #队列大小
                    thread_pool.get.size: 24                #启动线程数
                    thread_pool.get.queue_size: 10000        #队列长度
                    thread_pool.bulk.size: 24               #启动线程数
                    thread_pool.bulk.queue_size: 10000       #队列长度
                    thread_pool.refresh.core: 1             #最小1
                    thread_pool.refresh.max: 12             #最大12 cpu的一半
                    thread_pool.refresh.keep_alive: 2m      #2天不活跃的进城自动关闭
                    cluster.routing.allocation.node_initial_primaries_recoveries: 12         #节点重新启动后未分配的主节点的恢复使用来自本地磁盘的数据。多进程
                    cluster.routing.allocation.node_concurrent_incoming_recoveries: 12       #传入到这个节点的并发恢复分片数
                    cluster.routing.allocation.node_concurrent_outgoing_recoveries: 12       #传出到其他节点的并发恢复分片出
                    cluster.routing.allocation.node_concurrent_recoveries: 12                #同时recovery并发数
                    indices.memory.index_buffer_size: 20%                                   #每个index提供的缓冲大小
                    #集群配置
                    discovery.zen.ping.unicast.hosts: ["10.16.26.35", "10.16.26.34","10.16.26.31"]          #自动发现节点
                    discovery.zen.fd.ping_timeout: 120s
                    discovery.zen.fd.ping_retries: 6
                    discovery.zen.fd.ping_interval: 20s
                    discovery.zen.minimum_master_nodes: 2
                    gateway.recover_after_nodes: 2
3.安装kibana
                1. yum install kibana-5.6.4-1.x86_64
                2. 目录介绍
                    kibana 跟目录  /usr/share/kibana/
                    配置文件目录在  /etc/kibana/
                    数据目录             /var/lib/kibana/
                3.x-pack扩展
                    cd /usr/share/kibana/bin/  &&  ./kibana-plugin  install x-pack
                4.修改配置文件/etc/kibana/kibana.yml
                    server.port: 5601                                            #监听端口
                    server.host: "10.0.0.1"                              #监听地址
                    server.name: "kibana-1"                               #节点名
                    elasticsearch.url: "http://10.0.0.1:9200"   #读取es的东周
                    i18n.defaultLocale: "ch"
                    elasticsearch.username: "elastic"            #连接es的用户  此用户和密码是es安装x-pack之后默认生成
                    elasticsearch.password: "changeme"      #连接es的密码

                    #geoip地图地址库连接
                    tilemap.url: "http://webrd02.is.autonavi.com/appmaptile?lang=zh_cn&size=1&scale=1&style=7&x={x}&y={y}&z={z}"
                    tilemap.options.minZoom: "1"
                    tilemap.options.maxZoom: "10"
                    tilemap.options.attribution: "? [Elastic Maps Service](https://www.elastic.co/elastic-maps-service)"
4.重启es kibana
                    /etc/init.d/elasticsearch  stop && /etc/init.d/elasticsearch  start
                    /etc/init.d/kibana  restart
5.登陆kibana
1.web登陆http://10.0.0.1:5601
2.输入默认账号密码elastic changeme

3.选择 Dev Tools
4.创建角色 logstash
#创建logstash role权限
POST _xpack/security/role/logstash_writer
{
"cluster": ["manage_index_templates", "monitor"],
"indices": [{
"names": [ "logstash-*","business-index-*"],
"privileges": ["write","delete","create_index"]
}]
}
#创建logstash_用户
POST /_xpack/security/user/logstash_internal
{
"password" : "changeme",
"roles" : [ "logstash_writer"],
"full_name" : "Internal Logstash User"
}
5.启动logstash
/usr/share/logstash/bin/logstash "--path.settings" "/etc/logstash"
6.观察日志/var/log/logstash/logstash-plain.log