#(1)介绍
Prometheus 的告警功能被分成两部分:一个是告警规则的配置和检测,并将告警发送给 Alertmanager,另一个是 Alertmanager,它负责管理这些告警,去除重复数据,分组,并路由到对应的接收方式,发出报警。常见的接收方式有:Email、PagerDuty、HipChat、Slack、OpsGenie、WebHook丶wechat 等。
#(2)配置告警规则
1)prometheus的默认配置文件 prometheus.yml 有四大块:global、alerting、rule_files、scrape_config,其中 rule_files 块就是告警规则的配置项,alerting 块用于配置 Alertmanager, 先在rule_files 块中添加一个告警规则文件
#cat /prometheus.yml
rule_files:
- "/etc/prometheus/*.rules"![]()
2)创建告警规则目录
#test -d /etc/prometheus || mkdir /etc/prometheus -pv ; cd /etc/prometheus
3)创建一个cpu过高的告警规则文件, cpu使用率达到10% 就报警, 这里我是故意设置的;
# cat /etc/prometheus/cpu.rules
groups:
- name: hostStatsAlert
    rules:
    - alert: hostCpuUsageAlert
        #expr: sum(avg without (cpu)(irate(node_cpu{mode!='idle'}[5m]))) by (instance) > 0.85
        expr: 100 - (avg by (instance)(irate(node_cpu_seconds_total{instance=~"node.*",mode="idle"}[5m])) * 100) > 10
        for: 15s
        labels:
            severity: page
        annotations:
            summary: "Instance {{ $labels.instance }} CPU usgae high"
            description: "{{ $labels.instance }} CPU usage above 85% (current value: {{ $value }})"
4)告警规则文件详解
告警规则文件详解, 判断条件可以根据grafana中的metric值到prometheus进行查询和验证
    ALERT hostCpuUsageAlert   # alert 名字
     expr: 100 - (avg by (instance)(irate(node_cpu_seconds_total{instance=~"node.*",mode="idle"}[5m])) * 100) > 10           # 判断条件
     FOR 15s             # 条件保持 15s 才会发出 alert
     LABELS { severity = "critical" }  # 设置 alert 的标签
     ANNOTATIONS {             # alert 的其他标签,但不用于标识 alert
         summary = "告警标题",
         description = "告警的详细内容",
     }
5)可以在prometheus的alert界面看到告警

可以看到有一条 alert 的状态是 PENDING,这表示已经触发了告警规则,但还没有达到告警条件。这是因为这里配置的 for 参数是 15s,也就是 15 秒后才会触发告警,我们等 15秒,可以看到这条 alert 的状态变成了 FIRING
#(3)Alertmanager 发送告警通知
虽然 Prometheus 的 /alerts 页面可以看到所有的告警,但是还差最后一步:触发告警时自动发送通知。这是由 Alertmanager 来完成的,我们首先 下载并安装 Alertmanager,和其他 Prometheus 的组件一样,Alertmanager 也是开箱即用的
wget https://github.com/prometheus/alertmanager/releases/download/v0.15.2/alertmanager-0.15.2.linux-amd64.tar.gz
tar xvfz alertmanager-0.15.2.linux-amd64.tar.gz
cd alertmanager-0.15.2.linux-amd64
./alertmanager
Alertmanager 启动后默认可以通过 http://localhost:9093/ 来访问,但是现在还看不到告警,因为我们还没有把 Alertmanager 配置到 Prometheus 中,我们回到 Prometheus 的配置文件 prometheus.yml,添加下面几行:
alerting:
    alertmanagers:
    - scheme: http
        static_configs:
        - targets:
            - "192.168.1.51:9093"
这个配置告诉 Prometheus,当发生告警时,将告警信息发送到 Alertmanager,Alertmanager 的地址为 http://192.168.1.51:9093
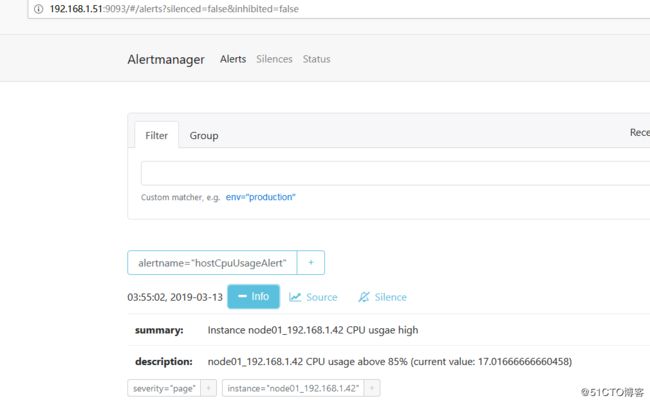
这个时候再访问 Alertmanager,可以看到 Alertmanager 已经接收到告警了:
#(4)让 Alertmanager 将告警信息通过微信发送
1)注册微信企业版
查看该文档: https://www.cnblogs.com/lovelinux199075/p/8986682.html
2)alertmanager配置
#cat alertmanager.yml
global:
    resolve_timeout: 5m  #该参数定义了当Alertmanager持续多长时间未接收到告警后标记告警状态为resolved(已解决)。该参数的定义可能会影响到告警恢复通知的接收时间,读者可根据自己的实际场景进行定义,其默认值为5分钟

templates:       #自定义告警模板文件
- './wechat.tmpl'

route:
    group_by: ['alertname']   # 将传入的报警中有这些标签的分为一个组.
    group_wait: 10s       # 指分组创建多久后才可以发送压缩的警报,也就是初次发警报的延时.这样会确保第一次通知的时候, 有更多的报警被压缩在一起.
    group_interval: 10s   # 当第一个通知发送,等待多久发送压缩的警报
    repeat_interval: 1h    # 如果报警发送成功, 等待多久重新发送一次
    receiver: 'wechat'     # 默认的接收器
receivers:
- name: 'wechat'
    wechat_configs:
    - corp_id: ''
        to_party: ''
        agent_id: ''
        api_secret: ''
        send_resolved: true

corp_id: 企业微信账号唯一 ID, 可以在我的企业中查看。
to_party: 需要发送的组。
agent_id: 第三方企业应用的 ID,可以在自己创建的第三方企业应用详情页面查看。
api_secret: 第三方企业应用的密钥,可以在自己创建的第三方企业应用详情页面查看。
3)wechat告警模板
# cat wechat.tmpl
{{ define "wechat.default.message" }}
{{ range .Alerts }}
========start==========
告警程序:prometheus_alert
告警级别:{{ .Labels.severity }}
告警类型:{{ .Labels.alertname }}
故障主机: {{ .Labels.instance }}
告警主题: {{ .Annotations.summary }}
告警详情: {{ .Annotations.description }}
触发时间: {{ .StartsAt.Format "2006-01-02 15:04:05" }}
========end==========
{{ end }}
{{ end }}
4)查看微信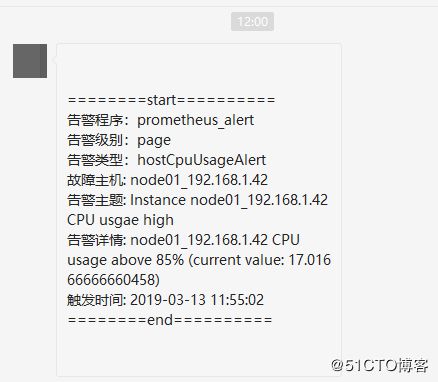
参考文档:
https://www.aneasystone.com/archives/2018/11/prometheus-in-action.html
https://blog.csdn.net/qq_25934401/article/details/83088344
https://yunlzheng.gitbook.io/prometheus-book/parti-prometheus-ji-chu/alert/alert-manager-route
https://www.cnblogs.com/lovelinux199075/p/8986682.html
https://www.cnblogs.com/cp-miao/p/9071939.html