matplotlib Artist 教程
总括
简介
在matplotlib API中有三个图层:matplotlib.backend_bases.FigureCanvas(画板)、matplotlib.backend_bases.Renderer(渲染)、matplotlib.artist.Artist(如何渲染)。我们大部分的时间都是处理Artists.
有两种类型的Artists:基础数据(primitives)代表了标准的我们想绘制的图形对象,比如Line2D、Rectangle,Text,AxesImage等;容器(container)代表了储存以上对象的地方,比如Axis,Axes和Figure。标准的使用流程是首先创建一个画板(figure)实例,然后再使用画板创建一个或多个轴(Axes)或子图(subplot)实例,然后使用轴实例方法,去创建基础数据(primitives)。
轴对象(Axes)可能是matplotlib API中最终要类,因为Axes是几乎所有对象的绘制区域,它有很多方法(plot(),text(),hist(),imshow())来创建图形基础数据(Line2D,Test,Rectangle,Image,respectively)。这些方法将会获取你的数据,然后创建基础的Artist实例(比如Line2D),然后添加他们去相关的容器中,最后在需要的时刻绘制出他们。你可能很熟悉subplot,它其实是Axes的一个特例。你可以通过add_axes()方法来创建任意位置的Axes对象。
import matplotlib.pyplot as plt
fig = plt.figure()
ax = fig.add_subplot(2,1,1) # two rows, one column, first plot
fig2 = plt.figure()
ax2 = fig2.add_axes([0.15, 0.1, 0.7, 0.3])
import numpy as np
t = np.arange(0.0, 1.0, 0.01)
s = np.sin(2*np.pi*t)
line, = ax.plot(t, s, color='blue', lw=2)
In [101]: ax.lines[0]
Out[101]: lines.Line2D instance at 0x19a95710>
在上例中,ax是Axes通过fig.add_subplot创建的一个实例对象,当你输入ax.plot时,它创建了一个Line2D实例并把它天剑到Axes.lines 列表里。如果你继续输入ax.plot,新的实例将会被添加到列表里。你可以删除这些实例:
del ax.lines[0]
ax.lines.remove(line) # one or the other, not both!
Axes也有可以装饰x轴刻度(x-axis tick)y轴刻度(y-axis tick),刻度标签(tick labels)和轴标签(axis labels):
xtext = ax.set_xlabel('my xdata') # returns a Text instance
ytext = ax.set_ylabel('my ydata')
当你使用ax.set_xlabel时,它将会传递信息给XAxis的Test实例。每一个Axes实例都包含了一个XAxis和一个YAxis实例,这些实例能够控制图层然后绘制刻度(ticks)、刻度标签(tick labels)和轴标签(axis labels)
Artist对象
每一个图片的元素都会被Artist控制,他们都含有很多的属性。figure对象包含了Rectangle实例,它可以设置背景颜色和透明度。同样的Axes也含有。这些实例被储存在Figure.patch.和Axes.patch中。每一个Artist都包含了以下的属性:
| Property | Description |
|---|---|
| alpha | The transparency - a scalar from 0-1 |
| animated | A boolean that is used to facilitate animated drawing |
| axes | The axes that the Artist lives in, possibly None |
| clip_box | The bounding box that clips the Artist |
| clip_on | Whether clipping is enabled |
| clip_path | The path the artist is clipped to |
| contains | A picking function to test whether the artist contains the pick point |
| figure | The figure instance the artist lives in, possibly None |
| label | A text label (e.g., for auto-labeling) |
| picker | A python object that controls object picking |
| transform | The transformation |
| visible | A boolean whether the artist should be drawn |
| zorder | A number which determines the drawing order |
| rasterized | Boolean; Turns vectors into rastergraphics: (for compression & eps transparency) |
你可以通过get&set的方式来设置这些属性
a = o.get_alpha()
o.set_alpha(0.5*a)
也可以一次设置多个属性
o.set(alpha=0.5, zorder=2)你可以通过matplotlib.artist.getp()方法来获得Artist的属性:
matplotlib.artist.getp(fig.patch)
alpha = 1.0
animated = False
antialiased or aa = True
axes = None
clip_box = None
clip_on = False
clip_path = None
contains = None
edgecolor or ec = w
facecolor or fc = 0.75
figure = Figure(8.125x6.125)
fill = 1
hatch = None
height = 1
label =
linewidth or lw = 1.0
picker = None
transform =
verts = ((0, 0), (0, 1), (1, 1), (1, 0))
visible = True
width = 1
window_extent =
x = 0
y = 0
zorder = 1
对象容器
primitives是哪些你想要设置的东西(比如,Test实例的字体,Line2D的宽度),而容器也包含了一些属性(比如,控制x轴(xaxis)是线性(linear)还是对数(log)的刻度(xscale))
画板容器(Figure container)
最高等级的Artist是Matplotlib.figure.Figure,它包含了所有的东西。画板的背景是Rectangle,它被存储在Figure.patch中。如果你增加了subplots(add_subplot())和axes(add_axes()),这些将被追加在Figure.axes中。
In [156]: fig = plt.figure()
In [157]: ax1 = fig.add_subplot(211)
In [158]: ax2 = fig.add_axes([0.1, 0.1, 0.7, 0.3])
In [159]: ax1
Out[159]: .axes.Subplot instance at 0xd54b26c>
In [160]: print fig.axes
[.axes.Subplot instance at 0xd54b26c>, .axes.Axes instance at␣
,→0xd3f0b2c>]
由于figure遵循了当前轴(current axes)的概念,所以你不能直接在轴列表(axes list)中添加或移除轴(Axes),你需要使用add_subplot()或者add_axes()方法。
figure也含有它自己的text、line、pathes和images。默认的坐标系统是像素(pixels)。
比较使用的画板坐标(figure coordinates)是(0,0)表示左下角(bottom-left)、(1,1)表示右上角(top-right),你可以设置fig.transFigure
In [191]: fig = plt.figure()
In [192]: l1 = matplotlib.lines.Line2D([0, 1], [0, 1],
transform=fig.transFigure, figure=fig)
In [193]: l2 = matplotlib.lines.Line2D([0, 1], [1, 0],
transform=fig.transFigure, figure=fig)
In [194]: fig.lines.extend([l1, l2])
In [195]: fig.canvas.draw()
下表是Figure的属性
| FigureAttribute | Description |
|---|---|
| axes | A list of Axes instances (includes Subplot) |
| patch | The Rectangle background |
| images | A list of FigureImages patches - useful for raw pixel display |
| legends | A list of Figure Legend instances (di erent from Axes.legends) |
| lines | A list of Figure Line2D instances (rarely used, see Axes.lines) |
| patches | A list of Figure patches (rarely used, see Axes.patches) |
| texts | A list Figure Text instances |
子图容器(Axes container)
就像Figure一样,它也包含了Patch,patch可以是一个方形的笛卡尔坐标(Cartesian),也可是是极坐标(polar),它决定了形状,背景和边缘。
ax = fig.add_subplot(111)
rect = ax.patch # a Rectangle instance
rect.set_facecolor('green')
当你输入plot(),这个方法将会创建一个matplotlib.lines.Line2D()实例,然后将这个实例放在Axes.lines中,并返回给你:
In [213]: x, y = np.random.rand(2, 100)
In [214]: line, = ax.plot(x, y, '-', color='blue', linewidth=2)
In [229]: print ax.lines
[instance at 0xd378b0c>]
相似的,方法同样创建了patches,就像bar()创建了一系列的rectangles,将添加patches在Axes.patches列表中:
In [233]: n, bins, rectangles = ax.hist(np.random.randn(1000), 50, facecolor='yellow')
In [234]: rectangles
Out[234]: of 50 Patch objects>
In [235]: print len(ax.patches)
你可以使用add_line()和add_patch()来添加队形到Axes中:
In [261]: fig = plt.figure()
In [262]: ax = fig.add_subplot(111)
# create a rectangle instance
In [263]: rect = matplotlib.patches.Rectangle( (1,1), width=5, height=12)
# by default the axes instance is None
In [264]: print rect.get_axes()
None
# and the transformation instance is set to the "identity transform"
In [265]: print rect.get_transform()
0x13695544>
# now we add the Rectangle to the Axes
In [266]: ax.add_patch(rect)
# and notice that the ax.add_patch method has set the axes
# instance
In [267]: print rect.get_axes()
Axes(0.125,0.1;0.775x0.8)
# and the transformation has been set too
In [268]: print rect.get_transform()
0x15009ca4>
# the default axes transformation is ax.transData
In [269]: print ax.transData
0x15009ca4>
# notice that the xlimits of the Axes have not been changed
In [270]: print ax.get_xlim()
(0.0, 1.0)
# but the data limits have been updated to encompass the rectangle
In [271]: print ax.dataLim.bounds
(1.0, 1.0, 5.0, 12.0)
# we can manually invoke the auto-scaling machinery
In [272]: ax.autoscale_view()
# and now the xlim are updated to encompass the rectangle
In [273]: print ax.get_xlim()
(1.0, 6.0)
# we have to manually force a figure draw
In [274]: ax.figure.canvas.draw()
这里有很多的Axes方法来创建primitive Artists然后把他们添加到相应的容器中,如下:
| Helper method | Artist | Container |
|---|---|---|
| ax.annotate - text annotations | Annotate | ax.texts |
| ax.bar - bar charts | Rectangle | ax.patches |
| ax.errorbar - error bar plots | Line2D and Rectangle | ax.lines and ax.patches |
| ax.fill - shared area | Polygon | ax.patches |
| ax.hist - histograms | Rectangle | ax.patches |
| ax.imshow - image data | AxesImage | ax.images |
| ax.legend - axes legends | Legend | ax.legends |
| ax.plot - xy plots | Line2D | ax.lines |
| ax.scatter - scatter charts | PolygonCollection | ax.collections |
| ax.text - text | Text | ax.texts |
Axes包含了两个比较重要的Artist容器:XAxis和YAxis,这两个容器控制了刻度(ticks)和标签(labels),他们的实例是xaxis和yaxis。
下面是Axes容器的属性:
| Axes attribute | Description |
|---|---|
| artists | A list of Artist instances |
| patch | Rectangle instance for Axes background |
| collections | A list of Collection instances |
| images | A list of AxesImage |
| legends | A list of Legend instances |
| lines | A list of Line2D instances |
| patches | A list of Patch instances |
| texts | A list of Text instances |
| xaxis | matplotlib.axis.XAxis instance |
| yaxis | matplotlib.axis.YAxis instance |
坐标轴容器(Axis containers)
matplotlib.axis.Axis实例控制了刻度线(tick),网格线(grid),刻度标签(ticklabels)和轴标签(axis label)。每一个Axis对象包含了label对象,也包含了大小刻度的列表。刻度对象的实例是XTick和YTick,你可以通过get_major_ticks() 和 get_minor_ticks()来获得他们。
 In [285]: axis = ax.xaxis

In [286]: axis.get_ticklocs()
Out[286]: array([ 0.,  1.,  2.,  3.,  4.,  5.,  6.,  7.,  8.,  9.])

In [287]: axis.get_ticklabels()
Out[287]: of 10 Text major ticklabel objects>

# note there are twice as many ticklines as labels because by
#  default there are tick lines at the top and bottom but only tick
#  labels below the xaxis; this can be customized
In [288]: axis.get_ticklines()
Out[288]: of 20 Line2D ticklines objects>

# by default you get the major ticks back
In [291]: axis.get_ticklines()
Out[291]: of 20 Line2D ticklines objects>

# but you can also ask for the minor ticks
In [292]: axis.get_ticklines(minor=True)
Out[292]: of 0 Line2D ticklines objects>
轴的方法总结:
| Accessor method | Description |
|---|---|
| get_scale | The scale of the axis, e.g., ‘log’ or ‘linear’ |
| get_view_interval | The interval instance of the axis view limits |
| get_data_interval | The interval instance of the axis data limits |
| get_gridlines | A list of grid lines for the Axis |
| get_label | The axis label - a Text instance |
| get_ticklabels | A list of Text instances - keyword minor=True |
| get_ticklines | A list of Line2D instances - keyword minor=True |
| get_ticklocs | A list of Tick locations - keyword minor=True |
| get_major_locator | The matplotlib.ticker.Locator instance for major ticks |
| get_major_formatter | The matplotlib.ticker.Formatter instance for major ticks |
| get_minor_locator | The matplotlib.ticker.Locator instance for minor ticks |
| get_minor_formatter | The matplotlib.ticker.Formatter instance for minor ticks |
| get_major_ticks | A list of Tick instances for major ticks |
| get_minor_ticks | A list of Tick instances for minor ticks |
| grid | Turn the grid on or off for the major or minor ticks |
例子:
import numpy as np
import matplotlib.pyplot as plt

# plt.figure creates a matplotlib.figure.Figure instance
fig = plt.figure()
rect = fig.patch # a rectangle instance
rect.set_facecolor('lightgoldenrodyellow')

ax1 = fig.add_axes([0.1, 0.3, 0.4, 0.4])
rect = ax1.patch
rect.set_facecolor('lightslategray')


for label in ax1.xaxis.get_ticklabels():
    # label is a Text instance
    label.set_color('red')
    label.set_rotation(45)
    label.set_fontsize(16)

for line in ax1.yaxis.get_ticklines():
    # line is a Line2D instance
    line.set_color('green')
    line.set_markersize(25)
    line.set_markeredgewidth(3)

plt.show()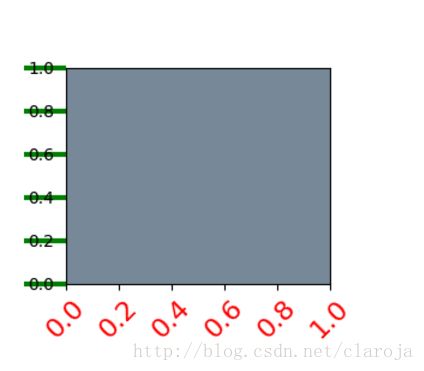
刻度容器(Tick containers)
matplotlib.axis.Tick是最低级的容积( 从Figure 到 Axes 到 Axis 到 Tick.)
| Tick attribute | Description |
|---|---|
| tick1line | Line2D instance |
| tick2line | Line2D instance |
| gridline | Line2D instance |
| label1 | Text instance |
| label2 | Text instance |
| gridOn | boolean which determines whether to draw the tickline |
| tick1On | boolean which determines whether to draw the 1st tickline |
| tick2On | boolean which determines whether to draw the 2nd tickline |
| label1On | boolean which determines whether to draw tick label |
| label2On | boolean which determines whether to draw tick label |
例子:
import numpy as np
import matplotlib.pyplot as plt
import matplotlib.ticker as ticker

# Fixing random state for reproducibility
np.random.seed(19680801)

fig = plt.figure()
ax = fig.add_subplot(111)
ax.plot(100*np.random.rand(20))

formatter = ticker.FormatStrFormatter('$%1.2f')
ax.yaxis.set_major_formatter(formatter)

for tick in ax.yaxis.get_major_ticks():
    tick.label1On = False
    tick.label2On = True
    tick.label2.set_color('green')

plt.show()