MATLAB 作图系列(一) 有源代码+效果图
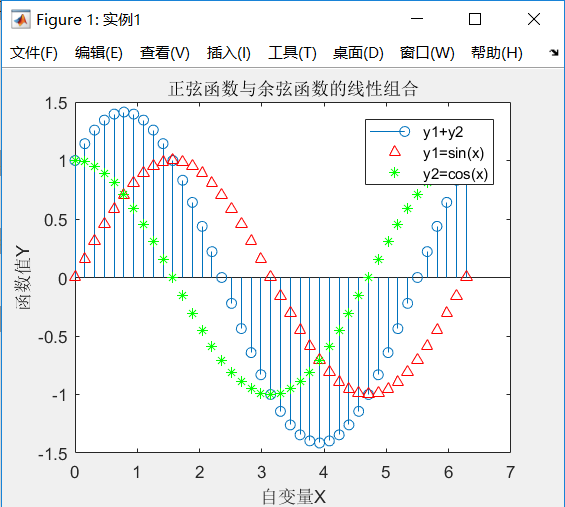
枝干图
function shili11
h0=figure('toolbar','none',...
          'position',[200 150 450 350],...
          'name','实例1');
x=0:pi/20:2*pi;
y1=sin(x);
y2=cos(x);
h1=stem(x,y1+y2);
hold on
h2=plot(x,y1,'^r',x,y2,'*g');
hold off
h3=[h1(1);h2];
legend(h3,'y1+y2','y1=sin(x)','y2=cos(x)')
xlabel('自变量X');
ylabel('函数值Y');
title('正弦函数与余弦函数的线性组合');
罗盘图
function shili12
h0=figure('toolbar','none',...
          'position',[200 150 450 250],...
          'name','实例12');
winddirection=[54 24 65 84
               256 12 235 62
               125 324 34 254];
windpower=[2 5 5 3
           6 8 12 7
           6 14 10 8];
 rdirection=winddirection*pi/180;
[x,y]=pol2cart(rdirection,windpower);
compass(x,y);
desc={'风向和风力',
       '北京气象台',
       '10月1日0:00到',
       '10月1日12:00'};
gtext(desc)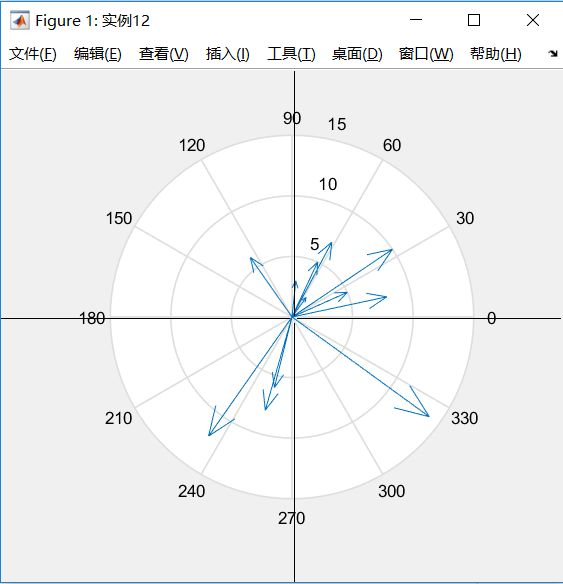
轮廓图
function shili13
h0=figure('toolbar','none',...
          'position',[200 150 450 250],...
          'name','实例13');
[th,r]=meshgrid((0:10:360)*pi/180,0:0.05:1);
[x,y]=pol2cart(th,r);
z=x+i*y;
f=(z.^4-1).^(0.25);
contour(x,y,abs(f),20)
axis equal
xlabel('实部','fontsize',16);
ylabel('虚部','fontsize',16);
h=polar([0 2*pi],[0 1]);
 delete(h)
hold on
contour(x,y,abs(f),20)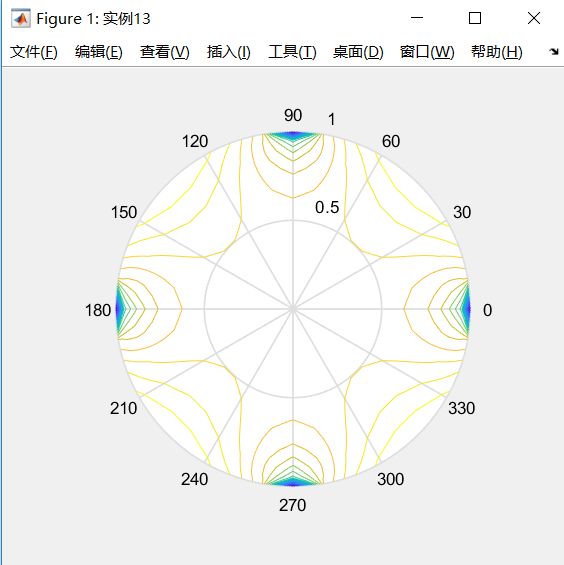
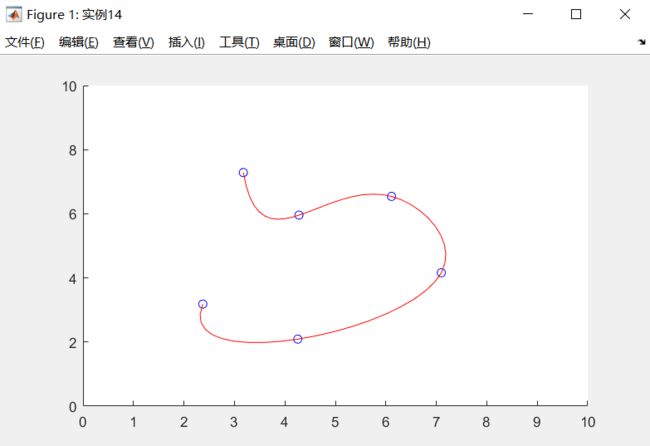
function shili14
 h0=figure('toolbar','none',...
           'position',[200 150 450 250],...
           'name','实例14');
axis([0 10 0 10]);
hold on
x=[];
y=[];
n=0;
disp('单击鼠标左键点取需要的点');
disp('单击鼠标右键点取最后一个点');
but=1;
while but==1
   [xi,yi,but]=ginput(1);
   plot(xi,yi,'bo')
    n=n+1;
   disp('单击鼠标左键点取下一个点');
   x(n,1)=xi;
   y(n,1)=yi;
end
t=1:n;
ts=1:0.1:n;
xs=spline(t,x,ts);
ys=spline(t,y,ts);
plot(xs,ys,'r-');
hold off
这图是我随手画出来演示的,实际图样根据建模具体情况构建。
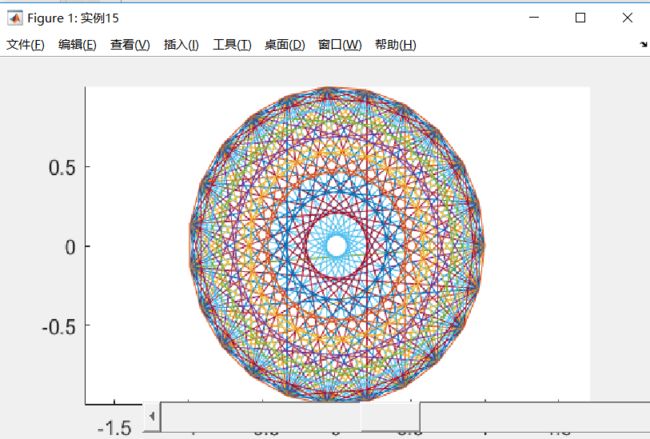
变换的傅立叶函数曲线
 function shili15
h0=figure('toolbar','none',...
          'position',[200 150 450 250],...
           'name','实例15');
axis equal
m=moviein(20,gcf);
set(gca,'nextplot','replacechildren')
 h=uicontrol('style','slider','position',...
             [100 10 500 20],'min',1,'max',20)
for j=1:20
      plot(fft(eye(j+16)))
      set(h,'value',j)
      m(:,j)=getframe(gcf);
end
clf;
axes('position',[0 0 1 1]);
movie(m,30)