sklearn:使用树集合进行特征转换
将您的功能转换为更高维度的稀疏空间。 然后训练这些特征的线性模型。
首先在训练集上安装一组树木(完全随机的树木,随机森林或梯度提升的树木)。 然后,在集合中的每个树的每个叶子被分配在新特征空间中的固定的任意特征索引。 然后以一热的方式编码这些叶索引。
每个样本都经过整体的每棵树的决定,并以每棵树的一片叶子结束。 通过将这些叶的特征值设置为1并将其他特征值设置为0来对样本进行编码。
然后,所得到的变换器学习了数据的监督的,稀疏的,高维的分类嵌入。
import numpy as np
np.random.seed(10)

import matplotlib.pyplot as plt

from sklearn.datasets import make_classification
from sklearn.linear_model import LogisticRegression
from sklearn.ensemble import (RandomTreesEmbedding, RandomForestClassifier,
                              GradientBoostingClassifier)
from sklearn.preprocessing import OneHotEncoder

from sklearn.model_selection import train_test_split
from sklearn.metrics import roc_curve
from sklearn.pipeline import make_pipeline

n_estimator = 10
X, y = make_classification(n_samples=80000)
X_train, X_test, y_train, y_test = train_test_split(X, y, test_size=0.5)
# It is important to train the ensemble of trees on a different subset
# of the training data than the linear regression model to avoid
# overfitting, in particular if the total number of leaves is
# similar to the number of training samples
X_train, X_train_lr, y_train, y_train_lr = train_test_split(X_train,
                                                            y_train,
                                                            test_size=0.5)

# Unsupervised transformation based on totally random trees
rt = RandomTreesEmbedding(max_depth=3, n_estimators=n_estimator,
	random_state=0)

rt_lm = LogisticRegression()
pipeline = make_pipeline(rt, rt_lm)
pipeline.fit(X_train, y_train)
y_pred_rt = pipeline.predict_proba(X_test)[:, 1]
fpr_rt_lm, tpr_rt_lm, _ = roc_curve(y_test, y_pred_rt)

# Supervised transformation based on random forests
rf = RandomForestClassifier(max_depth=3, n_estimators=n_estimator)
rf_enc = OneHotEncoder()
rf_lm = LogisticRegression()
rf.fit(X_train, y_train)
rf_enc.fit(rf.apply(X_train))
rf_lm.fit(rf_enc.transform(rf.apply(X_train_lr)), y_train_lr)

y_pred_rf_lm = rf_lm.predict_proba(rf_enc.transform(rf.apply(X_test)))[:, 1]
fpr_rf_lm, tpr_rf_lm, _ = roc_curve(y_test, y_pred_rf_lm)

grd = GradientBoostingClassifier(n_estimators=n_estimator)
grd_enc = OneHotEncoder()
grd_lm = LogisticRegression()
grd.fit(X_train, y_train)
grd_enc.fit(grd.apply(X_train)[:, :, 0])
grd_lm.fit(grd_enc.transform(grd.apply(X_train_lr)[:, :, 0]), y_train_lr)

y_pred_grd_lm = grd_lm.predict_proba(
    grd_enc.transform(grd.apply(X_test)[:, :, 0]))[:, 1]
fpr_grd_lm, tpr_grd_lm, _ = roc_curve(y_test, y_pred_grd_lm)


# The gradient boosted model by itself
y_pred_grd = grd.predict_proba(X_test)[:, 1]
fpr_grd, tpr_grd, _ = roc_curve(y_test, y_pred_grd)


# The random forest model by itself
y_pred_rf = rf.predict_proba(X_test)[:, 1]
fpr_rf, tpr_rf, _ = roc_curve(y_test, y_pred_rf)

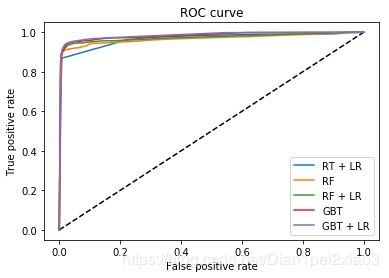
plt.figure(1)
plt.plot([0, 1], [0, 1], 'k--')
plt.plot(fpr_rt_lm, tpr_rt_lm, label='RT + LR')
plt.plot(fpr_rf, tpr_rf, label='RF')
plt.plot(fpr_rf_lm, tpr_rf_lm, label='RF + LR')
plt.plot(fpr_grd, tpr_grd, label='GBT')
plt.plot(fpr_grd_lm, tpr_grd_lm, label='GBT + LR')
plt.xlabel('False positive rate')
plt.ylabel('True positive rate')
plt.title('ROC curve')
plt.legend(loc='best')
plt.show()

plt.figure(2)
plt.xlim(0, 0.2)
plt.ylim(0.8, 1)
plt.plot([0, 1], [0, 1], 'k--')
plt.plot(fpr_rt_lm, tpr_rt_lm, label='RT + LR')
plt.plot(fpr_rf, tpr_rf, label='RF')
plt.plot(fpr_rf_lm, tpr_rf_lm, label='RF + LR')
plt.plot(fpr_grd, tpr_grd, label='GBT')
plt.plot(fpr_grd_lm, tpr_grd_lm, label='GBT + LR')
plt.xlabel('False positive rate')
plt.ylabel('True positive rate')
plt.title('ROC curve (zoomed in at top left)')
plt.legend(loc='best')
plt.show()
