R语言函数par()
电脑环境
win10 64 bit R x64 3.4.0 R studio v0.99.903
处理的数据
online shopping.txt
period amount
2008 1281.8
2009 2630.0
2010 4610.0
2011 7846.5
2012 13040.0
2013 18500.0
2014 24500.0
2015 30200.0
2016 36000.0
程序
#将读的txt格式数据放入dat中
dat=read.table("D:/R-TT/r-source/r-data/online shopping.txt",header=T)
#将dat数据读入缓存之中
attach(dat)
#生成1000正态分布的随机数据,默认平均数为0,方差为1
x=rnorm(1000)
#将三种形式数据组成数据框,x1为1到5,x2为正态分布,x3为gamma分布
y = data.frame(x1=1:5,x2=rnorm(5,0,1),x3=rgamma(5,2,3))
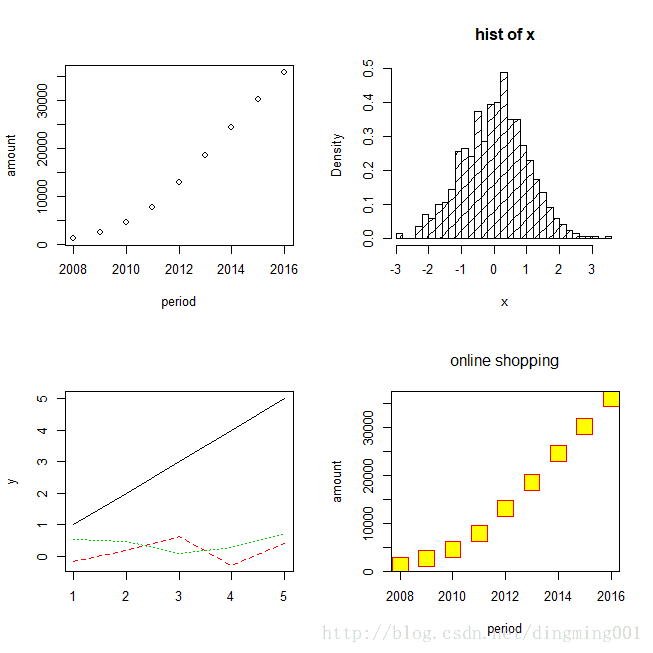
#将图形分为2*2的多重框,按照行分布,mfcol是按列分布
par(mfrow=c(2,2))
#默认为点图
plot(period,amount)
#xlim表示横坐标的值为x的从小到大排列,main表示标题,freq当为F表示频数为T是表示概率密度,nclass所有的数被分成的组数,这个值不为0,density阴影线的密度,以英寸为单位。默认值NULL意味着不绘制阴影线  angle阴影线的斜率,以度为单位(逆时针)给出。
hist(x,xlim = range(x),main = "hist of x",freq = F,nclass = 10,density = 25,angle = 45)当务
#用矩阵的列画多线图
matplot(y,type="l",col = 1:3)
#pch选择图标的形状,col图标外框,bg图标的背景颜色,cex图标大小
plot(period,amount,pch=22,col="red",bg="yellow",cex=1.5)
#最后一个图的标题,font.main=1为字体型号,adj为标题左中右位置选择
title("online shopping",font.main=1,adj=0.5)
无解释程序
dat=read.table("D:/R-TT/r-source/r-data/online shopping.txt",header=T)
attach(dat)
x=rnorm(1000)
#x=x[x>0]
y = data.frame(x1=1:5,x2=rnorm(5,0,1),x3=rgamma(5,2,3))
par(mfrow=c(2,2))
plot(period,amount)
hist(x,xlim = range(x),main = "hist of x",freq = F,nclass = 30,density = 10,angle = 45)
matplot(y,type="l",col = 1:3)
plot(period,amount,pch=22,col="red",bg="yellow",cex=3)
title("online shopping",font.main=1,adj=0.5)