R语言执行T检验
说明
a.单样本t检验可以帮助我们测试两个均值是否存在显著性差异
b.双样本t检验可以用来测试两组独立的数据集其均值是否不同
#导入数据
library(stats)
data("mtcars")
#操作
1)完成属性可视化处理,在盒图中分别展示mpg和am两个属性的差别:
boxplot(mtcars$mpg,mtcars$mpg[mtcars$am==0],ylab = "mpg",names = c("overall","automobile"))

boxplot(mtcars$mpg,mtcars$mpg[mtcars$am==0],ylab = "mpg",names = c("overall","automobile"))

abline(h = mean(mtcars$mpg),lwd = 2,col = "red")

abline(h = mean(mtcars$mpg[mtcars$am==0]),lwd = 2,col = "blue")
#执行统计分析来验证汽车类型的样本mpg均值是否低于总体样本的mpg值:
mpg.meanall = mean(mtcars$mpg)
mpg_am = mtcars$mpg[mtcars$am == 0]
t.test(mpg_am,mu = mpg.meanall)

    One Sample t-test

data:  mpg_am
t = -3.3462, df = 18, p-value = 0.003595
alternative hypothesis: true mean is not equal to 20.09062
95 percent confidence interval:
 15.29946 18.99528
sample estimates:
mean of x
 17.14737
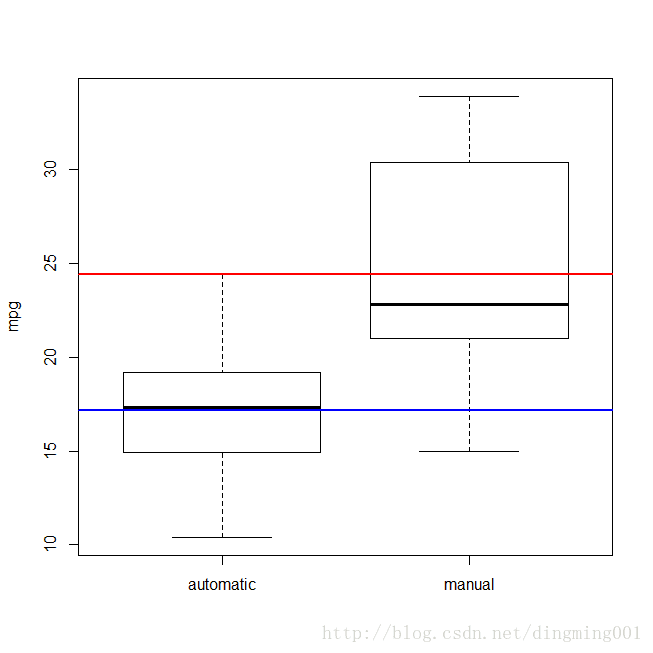
#采用盒图分析绘制结果,手动与自动的对比,红蓝线分别表示各自平均数
boxplot(mtcars$mpg~mtcars$am,ylab = "mpg",names = c("automatic","manual"))
#这条程序与之等价
boxplot(mtcars$mpg[mtcars$am==0],mtcars$mpg[mtcars$am==1],ylab = "mpg",names = c("automatic","manual"))
abline(h = mean(mtcars$mpg[mtcars$am==0]),lwd = 2,col = "blue")
abline(h = mean(mtcars$mpg[mtcars$am==1]),lwd = 2,col = "red")
#接下来分析自动档车的mpg值是否低于手动档的mpg
t.test(mtcars$mpg~mtcars$am)
Welch Two Sample t-test
data: mtcars$mpg by mtcars$am
t = -3.7671, df = 18.332, p-value = 0.001374
alternative hypothesis: true difference in means is not equal to 0
95 percent confidence interval:
-11.280194 -3.209684
sample estimates:
mean in group 0 mean in group 1
17.14737 24.39231
#注意两种间隔符的区别,可以表示相当意思
t.test(mtcars$mpg[mtcars$am==0],mtcars$mpg[mtcars$am==1])
Welch Two Sample t-test
data: mtcars$mpg[mtcars$am == 0] and mtcars$mpg[mtcars$am == 1]
t = -3.7671, df = 18.332, p-value = 0.001374
alternative hypothesis: true difference in means is not equal to 0
95 percent confidence interval:
-11.280194 -3.209684
sample estimates:
mean of x mean of y
17.14737 24.39231 分析
a.单样本检验中,由红蓝线的高度人们会有自动汽车的mpg的均值显著小于总体的mpg均值猜测。这为HO:u>=u0(原假设),
H1:u < u0(这是人们的假设,备择假设),u0代表总体mpg均值.我们使用了单样本t检验,得到的p-value = 0.003595,小于0.05,因此我们拒绝H0,接收H1,假设成立。
b.双样本检验中,可以判断两个均值是否有显著性差异。H0:u1=u2,H1:u1!=u2,p-value <0.05,拒绝H0,接收H1。假设成立。

