sklearn.datasets.make_blobs()函数用法
参考:https://scikit-learn.org/dev/modules/generated/sklearn.datasets.make_blobs.html
函数原型:sklearn.datasets.make_blobs(n_samples=100, n_features=2, centers=None, cluster_std=1.0, center_box=(-10.0, 10.0), shuffle=True, random_state=None)
参数解释:
n_samples(int/array):如果参数为int,代表总样本数;如果参数为array-like,数组中的每个数代表每一簇的样本数。默认值100
n_features(int):样本点的维度。默认值2
centers(int):样本中心数。如果样本数为int且centers=None,生成三个样本中心;如果样本数(n_samples)为数组,则centers 要么为None,要么为数组的长度。默认值3
cluster_std(float/sequence of floats):样本中,簇的标准差。默认值1.0
center_box(pair of floats (min, max)):每个簇的上下限。默认值(-10.0, 10.0)
shuffle(boolean):是否将样本打乱。默认值True
random_state(int/RandomState instance /None):指定随机数种子,每个种子生成的序列相同,与minecraft地图种子同理。
返回类型:X : 样本数组 [n_samples, n_features]
产生的样本
y : array of shape [n_samples]
每个簇的标签
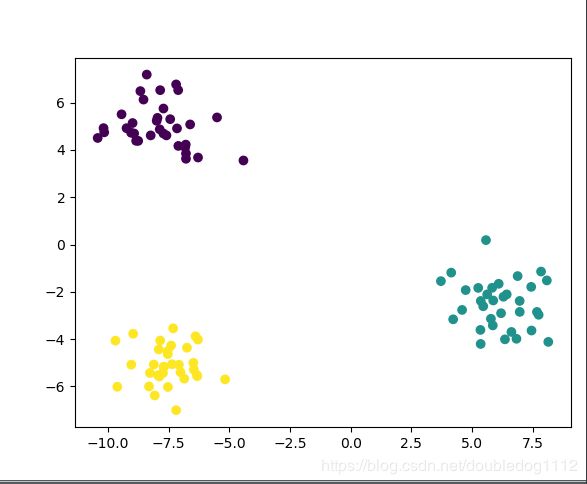
例子:
import matplotlib.pyplot as plt
from sklearn.datasets import make_blobs
#样本为数组方式
data,target=make_blobs(n_samples=[100,100],centers=None,cluster_std=1.0, center_box=(-10.0, 10.0),shuffle=True, random_state=None)

#在2D图中绘制样本,每个样本颜色不同
plt.scatter (data[:, 0], data[:, 1], c = target)
plt.show ()


#样本为整数
data,target=make_blobs(n_samples=100,n_features=2,centers=3,cluster_std=1.0, center_box=(-10.0, 10.0),shuffle=True, random_state=None)

#在2D图中绘制样本,每个样本颜色不同
plt.scatter (data[:, 0], data[:, 1], c = target)
plt.show ()
