简介
按照官方的说法:为设计和开发人员准备的简单、灵活的 JavaScript 图表工具。
Chart.js 是由社区共同维护的开源项目,提供 8 种可视化展现方式,每种方式都具有动态效果并且可定制。基于 HTML5 Canvas渲染图表,在所有现代浏览器(IE9+)上都有高效的绘图效率。可以根据窗口的尺寸变化重绘所有的图标,展现更加细腻。
关于 Chart.js 2.0版本说明
新增混合图标类型:混合并匹配条形图和折线图,以便在数据集之间提供清晰的视觉区分。
新增表轴类型:轻松绘制复杂的、日期稀疏矩阵的、对数的、甚至完全自定义的维度。
动画展现:在改变数据、更新颜色和添加数据时,均有开箱即用的动画效果。
官方链接
官网地址:https://chartjs.bootcss.com
官方Github 地址:https://github.com/chartjs/Ch...
下载与使用
使用 npm 下载
npm install chart.js --save在对应使用的 page 页面中
import Chart from 'chart.js'实例说明
新建一个 page 页面
cd 工程的目录
ionic generate page report-demoreport-demo.html
    图形化报表界面


        Pie Chart
report-demo.ts
import {Component, ViewChild} from '@angular/core';
import {IonicPage, NavController} from 'ionic-angular';
import chartJs from 'chart.js';

@IonicPage()
@Component({
  selector: 'page-report-demo',
  templateUrl: 'report-demo.html',
})
export class ReportDemoPage {
    // 获取到对应 canvas dom 元素
    @ViewChild('pieCanvas') pieCanvas;

    // 新建一个对象,作为初始化使用
    pieChart: any;

    constructor(public navCtrl: NavController) {
    }

    ngAfterViewInit() {
        // 初始化图表
        setTimeout(() => {
          this.pieChart = this.getPieChart();
        }, 350);
    }

 /**
   * 生成图表的公共方法
   * @param context 渲染的dom对象
   * @param chartType 生成图表的类型
   * @param data  生成图表的数据
   * @param options 生成图表的个性化参数
   */
  getChart(context, chartType, data, options?) {
    return new chartJs(context, {
      data,
      options,
      type: chartType,
    });
  }

  getPieChart() {
    const data = {
      labels: ['Red', 'Blue', 'Yellow'],
      datasets: [
        {
          data: [300, 50, 100],
          backgroundColor: ['#FF6384', '#36A2EB', '#FFCE56'],
          hoverBackgroundColor: ['#FF6384', '#36A2EB', '#FFCE56']
        }]
    };

    return this.getChart(this.pieCanvas.nativeElement, 'pie', data);
  }
}给出一个完整的例子
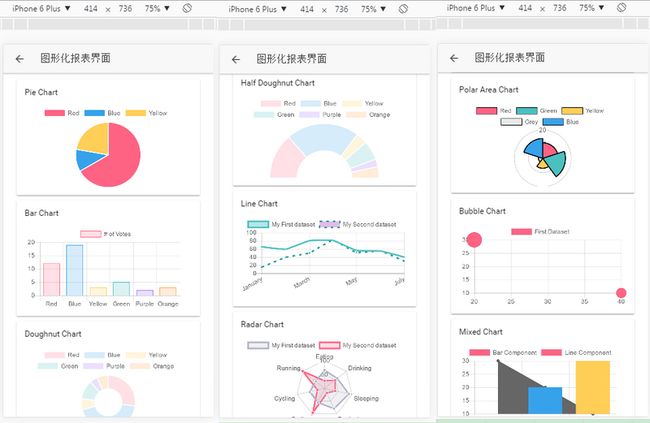
report-demo.html
    图形化报表界面


    Pie Chart


    Bar Chart


    Doughnut Chart


    Half Doughnut Chart


    Line Chart


    Radar Chart


    Polar Area Chart


    Bubble Chart


    Mixed Chart
report-demo.ts
import {Component, ViewChild} from '@angular/core';
import {IonicPage, NavController} from 'ionic-angular';
import chartJs from 'chart.js';

@IonicPage()
@Component({
  selector: 'page-report-demo',
  templateUrl: 'report-demo.html',
})
export class ReportDemoPage {

  @ViewChild('barCanvas') barCanvas;
  @ViewChild('doughnutCanvas') doughnutCanvas;
  @ViewChild('halfDoughnutCanvas') halfDoughnutCanvas;
  @ViewChild('lineCanvas') lineCanvas;
  @ViewChild('radarCanvas') radarCanvas;
  @ViewChild('polarCanvas') polarCanvas;
  @ViewChild('pieCanvas') pieCanvas;
  @ViewChild('bubbleCanvas') bubbleCanvas;
  @ViewChild('mixedCanvas') mixedCanvas;

  barChart: any;
  doughnutChart: any;
  halfDoughnutChart: any;
  lineChart: any;
  radarChart: any;
  polarAreaChart: any;
  pieChart: any;
  bubbleChart: any;
  mixedChart: any;

  constructor(public navCtrl: NavController) {
  }

  ngAfterViewInit() {

    setTimeout(() => {
      this.barChart = this.getBarChart();
      this.doughnutChart = this.getDoughnutChart();
      this.halfDoughnutChart = this.getHalfDoughnutChart();
    }, 150);

    setTimeout(() => {
      this.lineChart = this.getLineChart();
      this.radarChart = this.getRadarChart();
      this.polarAreaChart = this.getPolarAreaChart();
    }, 250);

    setTimeout(() => {
      this.bubbleChart = this.getBubbleChart();
      this.mixedChart = this.getMixedChart();
      this.pieChart = this.getPieChart();
    }, 350);

  }

  /**
   * 生成图表的公共方法
   * @param context 渲染的dom对象
   * @param chartType 生成图表的类型
   * @param data  生成图表的数据
   * @param options 生成图表的个性化参数
   */
  getChart(context, chartType, data, options?) {
    return new chartJs(context, {
      data,
      options,
      type: chartType,
    });
  }

  getMixedChart() {
    const data = {
      labels: ['Item 1', 'Item 2', 'Item 3'],
      datasets: [
        {
          type: 'bar',
          label: 'Bar Component',
          data: [10, 20, 30],
          backgroundColor: ['#FF6384', '#36A2EB', '#FFCE56'],
        },
        {
          type: 'line',
          label: 'Line Component',
          data: [30, 20, 10],
          backgroundColor: ['#FF6384', '#36A2EB', '#FFCE56'],
        }
      ]
    };

    return this.getChart(this.mixedCanvas.nativeElement, 'bar', data);

  }

  getPieChart() {
    const data = {
      labels: ['Red', 'Blue', 'Yellow'],
      datasets: [
        {
          data: [300, 50, 100],
          backgroundColor: ['#FF6384', '#36A2EB', '#FFCE56'],
          hoverBackgroundColor: ['#FF6384', '#36A2EB', '#FFCE56']
        }]
    };

    return this.getChart(this.pieCanvas.nativeElement, 'pie', data);

  }

  getPolarAreaChart() {
    const data = {
      datasets: [{
        data: [11, 16, 7, 3, 14],
        backgroundColor: ['#FF6384', '#4BC0C0', '#FFCE56', '#E7E9ED', '#36A2EB'],
        label: 'My dataset' // for the legend
      }],
      labels: ['Red', 'Green', 'Yellow', 'Grey', 'Blue']
    };

    const options = {
      elements: {
        arc: {
          borderColor: '#000000'
        }
      }
    };

    return this.getChart(this.polarCanvas.nativeElement, 'polarArea', data, options);
  }

  getBubbleChart() {
    const data = {
      datasets: [
        {
          label: 'First Dataset',
          data: [
            {x: 20, y: 30, r: 15},
            {x: 40, y: 10, r: 10},
          ],
          backgroundColor: '#FF6384',
          hoverBackgroundColor: '#FF6384',
        }]
    };

    const options = {
      elements: {
        points: {
          borderWidth: 1,
          borderColor: 'rgb(0, 0, 0)'
        }
      }
    };

    return this.getChart(this.bubbleCanvas.nativeElement, 'bubble', data, options);
  }

  getRadarChart() {
    const data = {
      labels: ['Eating', 'Drinking', 'Sleeping', 'Designing', 'Coding', 'Cycling', 'Running'],
      datasets: [
        {
          label: 'My First dataset',
          backgroundColor: 'rgba(179,181,198,0.2)',
          borderColor: 'rgba(179,181,198,1)',
          pointBackgroundColor: 'rgba(179,181,198,1)',
          pointBorderColor: '#fff',
          pointHoverBackgroundColor: '#fff',
          pointHoverBorderColor: 'rgba(179,181,198,1)',
          data: [65, 59, 90, 81, 56, 55, 40]
        },
        {
          label: 'My Second dataset',
          backgroundColor: 'rgba(255,99,132,0.2)',
          borderColor: 'rgba(255,99,132,1)',
          pointBackgroundColor: 'rgba(255,99,132,1)',
          pointBorderColor: '#fff',
          pointHoverBackgroundColor: '#fff',
          pointHoverBorderColor: 'rgba(255,99,132,1)',
          data: [28, 48, 40, 19, 96, 27, 100]
        }
      ]
    };

    const options = {
      scale: {
        reverse: true,
        ticks: {
          beginAtZero: true
        }
      }
    };

    return this.getChart(this.radarCanvas.nativeElement, 'radar', data, options);
  }

  getDoughnutChart() {
    const data = {
      labels: ['Red', 'Blue', 'Yellow', 'Green', 'Purple', 'Orange'],
      datasets: [{
        label: '# of Votes',
        data: [12, 19, 3, 5, 2, 3],
        backgroundColor: [
          'rgba(255, 99, 132, 0.2)',
          'rgba(54, 162, 235, 0.2)',
          'rgba(255, 206, 86, 0.2)',
          'rgba(75, 192, 192, 0.2)',
          'rgba(153, 102, 255, 0.2)',
          'rgba(255, 159, 64, 0.2)'
        ],
        hoverBackgroundColor: ['#FF6384', '#36A2EB', '#FFCE56', '#FF6384', '#36A2EB', '#FFCE56']
      }]
    };

    return this.getChart(this.doughnutCanvas.nativeElement, 'doughnut', data);
  }

  getHalfDoughnutChart() {
    const data = {
      labels: ['Red', 'Blue', 'Yellow', 'Green', 'Purple', 'Orange'],
      datasets: [{
        label: '# of Votes',
        data: [12, 19, 3, 5, 2, 3],
        backgroundColor: [
          'rgba(255, 99, 132, 0.2)',
          'rgba(54, 162, 235, 0.2)',
          'rgba(255, 206, 86, 0.2)',
          'rgba(75, 192, 192, 0.2)',
          'rgba(153, 102, 255, 0.2)',
          'rgba(255, 159, 64, 0.2)'
        ],
        hoverBackgroundColor: ['#FF6384', '#36A2EB', '#FFCE56', '#FF6384', '#36A2EB', '#FFCE56']
      }]
    };

    const options = {
      circumference: Math.PI,
      rotation: 1.0 * Math.PI
    };

    return this.getChart(this.halfDoughnutCanvas.nativeElement, 'doughnut', data, options);
  }

  getBarChart() {
    const data = {
      labels: ['Red', 'Blue', 'Yellow', 'Green', 'Purple', 'Orange'],
      datasets: [{
        label: '# of Votes',
        data: [12, 19, 3, 5, 2, 3],
        backgroundColor: [
          'rgba(255, 99, 132, 0.2)',
          'rgba(54, 162, 235, 0.2)',
          'rgba(255, 206, 86, 0.2)',
          'rgba(75, 192, 192, 0.2)',
          'rgba(153, 102, 255, 0.2)',
          'rgba(255, 159, 64, 0.2)'
        ],
        borderColor: [
          'rgba(255,99,132,1)',
          'rgba(54, 162, 235, 1)',
          'rgba(255, 206, 86, 1)',
          'rgba(75, 192, 192, 1)',
          'rgba(153, 102, 255, 1)',
          'rgba(255, 159, 64, 1)'
        ],
        borderWidth: 1
      }]
    };

    const options = {
      scales: {
        yAxes: [{
          ticks: {
            beginAtZero: true
          }
        }]
      }
    };

    return this.getChart(this.barCanvas.nativeElement, 'bar', data, options);
  }

  getLineChart() {
    const data = {
      labels: ['January', 'February', 'March', 'April', 'May', 'June', 'July'],
      datasets: [
        {
          label: 'My First dataset',
          fill: false,
          lineTension: 0.1,
          backgroundColor: 'rgba(75,192,192,0.4)',
          borderColor: 'rgba(75,192,192,1)',
          borderCapStyle: 'butt',
          borderDash: [],
          borderDashOffset: 0.0,
          borderJoinStyle: 'miter',
          pointBorderColor: 'rgba(75,192,192,1)',
          pointBackgroundColor: '#fff',
          pointBorderWidth: 1,
          pointHoverRadius: 5,
          pointHoverBackgroundColor: 'rgba(75,192,192,1)',
          pointHoverBorderColor: 'rgba(220,220,220,1)',
          pointHoverBorderWidth: 2,
          pointRadius: 1,
          pointHitRadius: 10,
          data: [65, 59, 80, 81, 56, 55, 40],
          spanGaps: false,
        },
        {
          label: 'My Second dataset',
          fill: false,
          lineTension: 0.1,
          backgroundColor: 'rgba(175,92,192,0.4)',
          borderColor: 'rgba(31,156,156,1)',
          borderCapStyle: 'butt',
          borderDash: [5, 8],
          borderDashOffset: 0.0,
          borderJoinStyle: 'miter',
          pointBorderColor: 'rgba(31,156,156,1)',
          pointBackgroundColor: '#fff',
          pointBorderWidth: 1,
          pointHoverRadius: 5,
          pointHoverBackgroundColor: 'rgba(31,156,156,1)',
          pointHoverBorderColor: 'rgba(220,220,220,1)',
          pointHoverBorderWidth: 2,
          pointRadius: 1,
          pointHitRadius: 10,
          data: [15, 39, 50, 81, 51, 55, 30],
          spanGaps: false,
        }
      ]
    };

    return this.getChart(this.lineCanvas.nativeElement, 'line', data);
  }
}
