使用 prometheus + grafana 监控 ceph 集群
一、Prometheus简介
Prometheus是一个开源的系统监控和报警的工具包,最初由SoundCloud发布。它通过HTTP协议从远程的机器收集数据并存储在本地的时序数据库上。它提供了一个简单的网页界面、一个功能强大的查询语言以及HTTP接口等等。Prometheus通过安装在远程机器上的exporter来收集监控数据。
特点:
- 多维数据模型(有metric名称和键值对确定的时间序列)
- 灵活的查询语言
- 不依赖分布式存储
- 通过pull方式采集时间序列,通过http协议传输
- 支持通过中介网关的push时间序列的方式
- 监控数据通过服务或者静态配置来发现
- 支持图表和dashboard等多种方式
二、Grafana简介
Grafana是一个可视化面板(Dashboard),有着非常漂亮的图表和布局展示,功能齐全的度量仪表盘和图形编辑器,支持Graphite、zabbix、InfluxDB、Prometheus和OpenTSDB作为数据源。
Grafana主要特性:
- 灵活丰富的图形化选项
- 可以混合多种风格
- 支持白天和夜间模式
- 支持多个数据源
三、Ceph监控方案
Ceph的监控方案有很多,有专业的Calamari,也有基于Zabbix+Grafana的,也有基于telegraf+influxdb+grafana的。不过不管用什么,我们的目的其实是能够第一时间直观的看到Ceph集群的运行状态。
对于Ceph监控,需求也很简单:
- Cluster、Mon节点、OSD节点和Pools的状态检查
- pg状态和object数量
- 存储总容量、使用量、iops和吞吐量
- Ceph存储网卡流量,CPU内存利用率等
- 查看数据的延迟
- 监控多套Ceph集群
这里推荐的是使用 prometheus + grafana 监控 ceph 集群的方案。
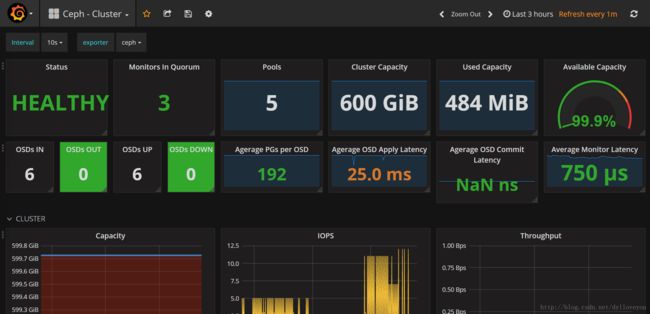
目前Ceph网上流行的Grafana模板如下图:
集群信息
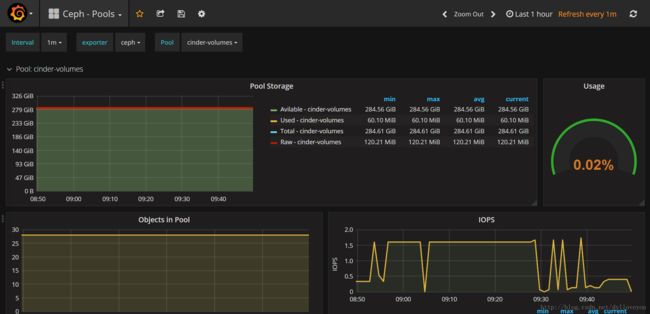
pool信息
OSD信息

其实可以看到默认的三个展示页面已经能够满足我们的大部分需求了,日常工作中大部分时间都是关注集群的监控状态和iops,而且这个基于全开源的方案,非常不错。
四、环境搭建
1.环境准备
节点 ceph-client(已经安装Ceph,作为Ceph客户端) 安装 ceph_exporter
节点 prometheus-test 安装 prometheus、grafana
2.安装配置prometheus
下载 https://github.com/prometheus/prometheus/releases/download/v2.0.0/prometheus-2.0.0.linux-amd64.tar.gz
解压 tar -zxvf prometheus-2.0.0.linux-amd64.tar.gz
cd prometheus-2.0.0.linux-amd64修改 prometheus.yml 增加 job
  - job_name: 'ceph'
    honor_labels: true
    file_sd_configs:
      - files:
        - ceph_targets.yml
同路径创建ceph_targets.yml
[
    {
        "targets": [ "ceph-client:9128" ],
        "labels": {
            "instance": "ceph_cluster"
        }
    }
]
启动 nohup ./prometheus &
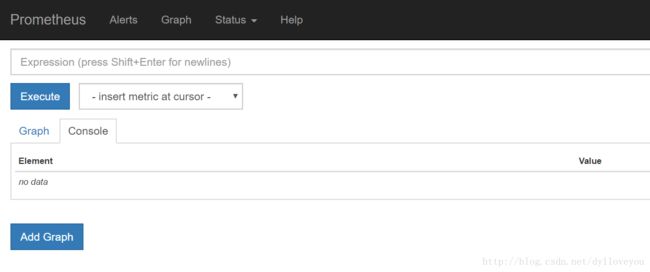
检验:http://prometheus-test:9090
3.安装 ceph_exporter
安装依赖包
yum install golang
yum install librados2-devel librbd1-devel
vi /etc/profile.d/go.sh (新增环境变量文件)
export GOROOT=/usr/lib/golang
export GOBIN=$GOROOT/bin
export GOPATH=/home/golang
export PATH=$PATH:$GOROOT/bin:$GOPATH/bin
source /etc/profile.d/go.sh安装ceph_exporter
go get -u github.com/digitalocean/ceph_exportercd /usr/lib/golang/bin/启动 nohup ./ceph_exporter &
检验:http://ceph-client:9128

在Prometheus界面,选择 Status->Targets 显示ceph exporter已经可用

4.安装配置grafana
下载 wget https://s3-us-west-2.amazonaws.com/grafana-releases/release/grafana-4.6.3-1.x86_64.rpm
安装
yum install grafana-4.6.3-1.x86_64.rpm启动
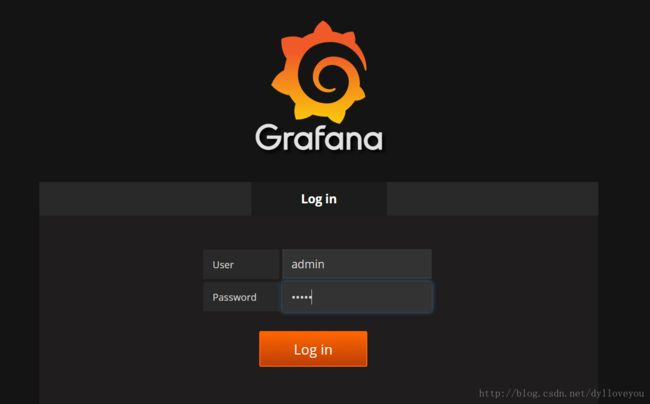
systemctl start grafana-server登陆 http://prometheus-test:3000/
默认用户名密码:admin/admin
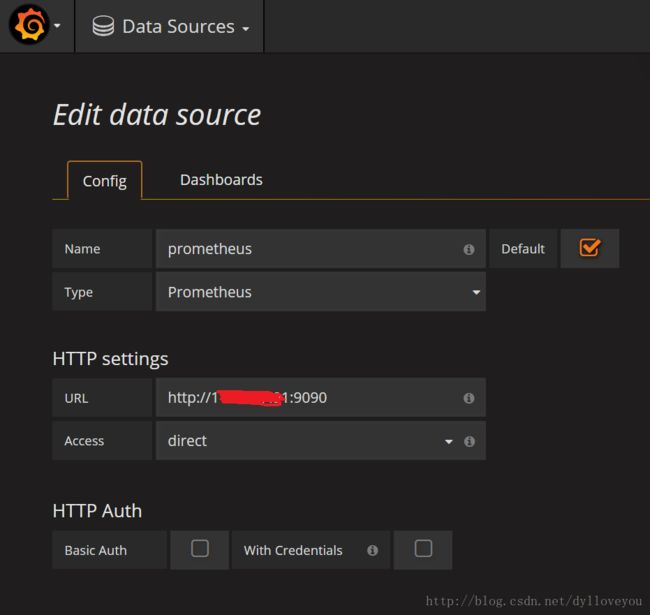
添加prometheus数据源
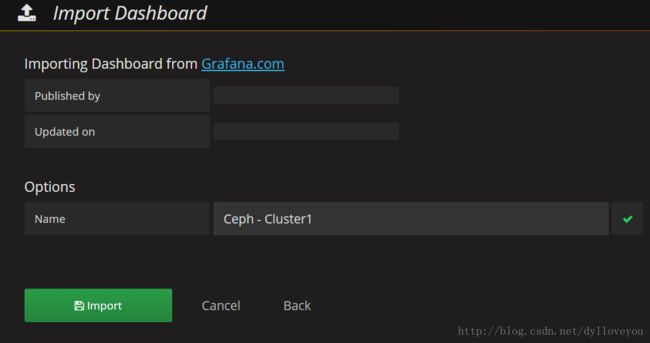
导入模板
ceph 的 Dashboard 模板可用从这里下载 https://github.com/magine1989/Ceph_Prometheus_Grafana
然后导入,分别导入3个Dashboard
导入后就可以看到了
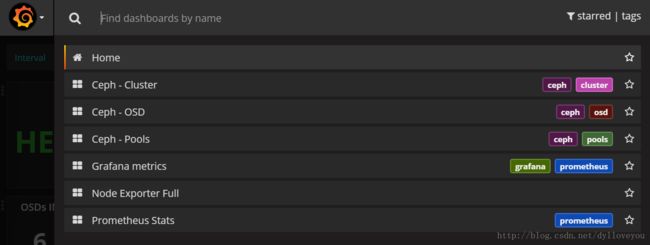
等一会儿,数据都上来了,就可以看到本文前面列出的3个面板了。
参考文档:
https://www.jianshu.com/p/0dcdbc1135bd
https://www.cnblogs.com/shhnwangjian/p/6878199.html
http://blog.csdn.net/ZZZZZZKAI/article/details/78899780
http://blog.51cto.com/youerning/2050543?from=timeline
https://segmentfault.com/a/1190000007040144
http://www.ywnds.com/?p=5903