2019.Jan
# 集成聚类模块
LWEC - Dong, 2018
MIA - Jinyu Chen & Shihua Zhang, 2018
⚪Joint NMF,2012(multi-dimensions data)
Discovery of multi-dimensional modules byintegrative analysis of cancer genomic data - Shihua Zhang, 2012
Linear?
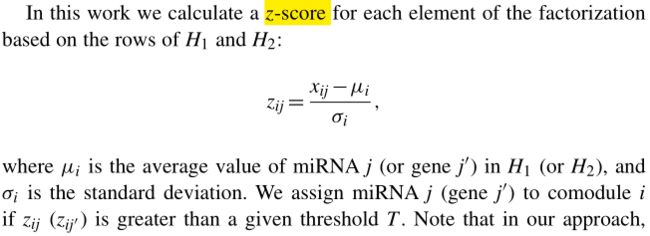
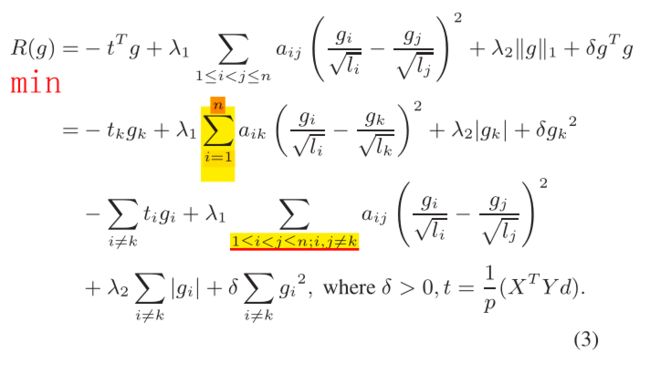
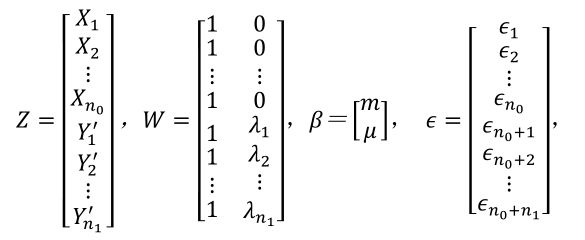
K A novel computational framework for simultaneousintegration of multiple types of genomic data to identifymicroRNA-gene regulatory modules - Shihua Zhang, 2011 Dataset:1、TCGA (gene miRNA expression data) 2、GO biological process 3、KEGG pathways 4、MicroCosm (miRNA-gene network) Comodule assignment: Evaluation(Functional Analysis) 1、Statistical significance: (p-value of the Pearson's correlation coefficients) 2、Biological significance: (miRBase-miRNA enrichment; Gene Ontology(GO) biological process(BP)-Gene enrichment; KEGG-metabolism pathway; NCBI gene ID-gene index) 3、Network & literature analysis: (IPA-Ingenuity Pathway Analysis; Genes Dev, Cancer Res, BMC Cancer, Journal of Cancer) 4、clinical data: from TCGA portal wesite(Kaplan-Meier survival analysis method) 5、Compare with other methods: EBC method(Peng,X. et al. (2009) Computational identification of hepatitis C virus associated microRNA-mRNA regulatory modules in human livers) Identifying multi-layer gene regulatory modules frommulti-dimensional genomic data - Shihua Zhang, 2012 PLS works very well for data with small sample sizes & a large number of parameters. And it's a dimension reduction & regression approach. Partial least squares: a versatile toolfor the analysis of high-dimensionalgenomic data - Boulesteix, 2006 Purpose 1、Systematically overview the PLS methods 2、Reviewing the broad range of applications to genome data Modeling(PLS) First, centralized the variables so that X is the predictor variables, Y is the response variables. T can be deem as a latent component matrix to construct both X and Y. And T is the linear combination of X with coefficient matrix W. Then Q、P are the loading matrices, E、F are the random errors matrices. B is the regression coefficient matrix. The space spanned by the columns of T is more important than the columns themselves, because so do There are four forms of objective functions: 1、univariate response(PLS1) maximize the squared sample covariance (means most significant linear association) with uncorrelated latent components and unit length Multivariate response 2、PLS2 is the Moore-Penrose inverse *3、Statistically Inspired Modification of PLS(SIMPLS) Maximize the covariance between latent variables of X & Y,() Modeling(sMBPLS) sMBPLS can identify the linear(covariance) structure between multiple (3)predictor matrices and a respose matrix with the sparse regularization. Object function--- Demulation the terms of and is a constant, thus they won't effect the maximum of object function, and they will also bring convenience to optimize with soft thresholding! 1、for a fixed and , with 0 derivation and 2、for a fixed and , with soft thresholding and 3、for a fixed and , as above Then, update until convergence. Note that, each iterative procedure can identify a module. After each iteration, we should deflate the matrix by subtracting the module for identifying another module. Remove the module's signal with: Integrative analysis for identifying jointmodular patterns of gene-expression anddrug-response data - Shihua Zhang, 2016 Purpose PLS with sparse and Network regularization. Modeling construct summary vector object function subject to Demulation 1、Fix g, with then , ▲2、Fix d, first detailed object function about g as: Let gradient be 0, then where and is the jth vector of update for k=1,2,...,n; Supplement ⚪Determine k of NMF 1. Cophenetic correlation coefficient (Brunet et al., 2004; Zitnik and Zupan, 2015) 2. Distance between X & WH (Kim and Tidor, 2003; Zitnik and Zupan, 2015; Zitnik et al., 2015 ) 3. learned basis matrix W achieves the lowest instability under different initial starting points (Wu et al. 2016) 提出一个能自动更新样本关系图且自主学习视角权重的多视角聚类算法,并分析了正则化中惩罚因子的具体意义。 ⚪自适应近邻(Adaptive Neighbour) ————————(1) 第二项使得更加平滑,惩罚参数与构建时的近邻数目有着隐晦的关系,在后面的一节中将会分析到。不过,也可以简单看出与近邻数存在相关关系。时只会在样本距离最小时取1,而时,会均匀化。 ⚪图正则化(Graph Regularization) 上述cost function不能保证学出的近邻矩阵有对应着簇数目的连通模块。可知该矩阵的零度对应着簇的数目,因而加入约束条件能保证接近于block matrix。 而优化这个正则项可以转化为解: (上式能促使,但不能限制的情况,还是说自然情况下秩就会有变大的趋势?) ⚪含参的多视角数据融合 参数指的是视角权重的正则因子,含参视角加权有两种表达形式: ————————(2) 或者: ————————(3) ⚪无参的多视角数据融合 ————————(4) 上式其实存有“权重”,只不过是通过样本的综合距离表示出来的。 (4)的拉格朗日函数对S 求导有: 自然有————————(5) 目标函数————————(6) 通过替代优化的方法分别按(8)(5)式更新和就能收敛代价函数 令, (6)式即化为————————(7) S 的更新式易得————————(8) ⚪权重因子 对于式(2)的设法 令 式(2)关于的拉格朗日函数为: 消去μ 后得到————————(9) 可见 对应均匀权重的情况;对应只给最小的分配1的情况。 对于式(3)的设法 即是 l2范数正则化,对应只给最小的分配1的情况;对应均匀权重的情况; ⚪关系矩阵近邻数 (8)式关于的拉格朗日函数为: 最优解为, 令以增序排列,由 有 ⚪图正则化 这项因子文中没有给出很具体的分析,实验里把它设为一个1-30的随机正值,并通过缩放来微调。 当时,通过减小;当时,通过增大。 1、图正则化项(R k×n)对“连接块数”检测的影响(S 的 heatmap)测rank 2、图正则化因子λ 在迭代过程中对rank(S) 或者的影响 3、S L2 norm 正则化对(或者受)KNN K 的影响(S排序的heatmap) 4、无参权重与有参权重的性能区别 5、优化中F=F_old 的问题 6、α的取值问题 7、终止迭代的收敛条件 与MVAN有些许不同,MVAN是一边根据数据更新关系矩阵一边优化,而SWMV是已经通过CLR构造出关联矩阵Av,再统一学习出关系矩阵 快速构造自学习,稀疏,近邻,无超参且有尺度不变性的关系矩阵 这篇paper基于semi-NMF及其改进Deep-semiNMF模型提出了一个多视觉的算法。该算法其实引入了视觉全权重的学习机制以及增加了一个图正则化,而且笔者发现算法中 consensus layers Hm 的构造过程还存在缺陷,没能实现完全意义的 global。 ⚪Semi - NMF Convex and semi-nonnegative matrix factorizations - 2010, Jordan 基于NMF有一个比较强的约束:数据集X 为非负。Semi-NMF的改进是把数据集拆解成“正部” 和“负部” 两部分(类似虚实奇偶部),那么表示X 的特征层Z 就能包含正负元素的基底,而且保持indicator G 的正约束,任然留有高解释性。 最重要的是,依然能像NMF 那样用梯度下降法优化。 直观来讲就是: 令 目标函数: 优化过程 1、固定H 更新Z,能找到的局部最优解 2、固定Z 更新H,能让J 单调递减 令J 的拉格朗日函数关于H 的导数为0 再利用KKT 条件 再对第一项进行正负部分解,能得到H 在正约束下的更新式 ⚪Deep Semi-NMF A Deep Semi-NMF Model for Learning Hidden Representations - Trigeorgis, 2014 这个算法提出增添特征层Z 的数量以达到类似“深度”学习的效果,对隐含层特征的学习得更加细致全面,所以最终得到的结果的解释性和稳定性应该更佳。 目标函数 优化 1、初始化 因为, 所以先将每一层用semi-NMF 初始化 2、固定H,优化Z 首先重建H , 令,左逆,右逆 3、固定Z,优化H 优化的过程与Deep semi-NMF 相似,不过作者给的代码中consensus layer Hm 的优化存在问题,学得的是v个Hm。 主要关注视角权重因子 的更新 参照上文MVAN 的式(9) 令即可解得 1、Error: Hm 不是consensus indicator 而是各个优化而来的 2、另一种权重因子对weight分配的影响(水平柱形图) 3、layer 深度对性能的影响 4、迭代次数的选取(一直在降) 与一般多视角集成算法不同,MVLRMF算法最终学出V 个簇的系数矩阵。一方面,作者希望这些低秩矩阵能保持对应视角的数据流形结构;另一方面,作者希望不同视角的表征矩阵差异性尽可能小。在此方向上,作者设计出对应的目标函数,算出的系数矩阵重构出数据关系的低秩表示。 此前区分视角的集成聚类算法为: 考虑到:1、不能灵活地表征隐含的数据关系 2、对作约束不一定能高效地兼顾单一视角结构表征以及全体视角的模型学习。 由,将改进为。能看出原自self-expression 模型被转化为dictionary learning,由的个主成分基底组合而成。 的约束可转移到上完成,而且有更加直观简洁的形式。 目标函数如下: 用ALM求解即可,值得注意的是,若以矩阵形式优化,有: 其复杂度是 而按行向量形式优化为: 复杂度减小为 1、高甲基化的基因不表达或者表达的程度很低,导致抑癌基因丧失功能;低甲基化基因可促使癌基因活化。目前几乎所有类型的癌细胞都伴随着DNA甲基化异常。 2、肿瘤纯度是肿瘤组织中肿瘤细胞所占的比例。纯度估计的金标准是ABSOLUTE(或InfiniumPurify) Absolute quantification of somatic DNA alterations in human cancer 3、恶性肿瘤的形成是一个长期的多因素的分阶段过程,需要多个原癌基因的突变以及多个抑癌基因的失活,以及凋亡调节、DNA修复基因的改变。 4、*原发同一部位的肿瘤有着很大的异质性,这些肿瘤仅仅在病理上相同,在更细的地方仍然存在差异,根据不同的临床和分子数据将肿瘤分为不同的亚型是分析的核心步骤。 1、肿瘤样本的纯度对聚类结果产生偏差,具有相似纯度的肿瘤样本倾向于聚在一类。 2、直接对癌症细胞和正常细胞的混合组织进行聚类会得到有偏的结果。 1、 利用正规方程解β:, 求得和后获得: 估计:, 理论论证引入纯度因子能降低肿瘤样本的内部方差 2、反正弦arcsine比logistic变换更具有线性型,变换后的数据更加符合正态分布。 正常样本,纯肿瘤样本 得混合肿瘤样本的分布: 转化为K成分的混合高斯模型,需要估计的参数为 通过EM算法可以求得聚类结果,有 2、q-value 类间评估-聚类精度:正确聚类的样本占全部样本的比例。聚类结果与参照集制成一个K*K表,元素(i,j)表示样本属于真实类的i个亚型,聚类的j个亚型,打乱表的行列直至对角线总和达到最大值,总和占样本总数的比例就是聚类精度。 NMF算法不能兼容负的输入,而且测得的数据结构只跟输入的原数据有关,不能很好地拟合不同输入的结构。此论文提出能处理负输入、检测数据固有结构的算法。 Document Clustering by Concept Factorization - Xu, 2014 首先,Concept Factorization(CF)以数据矩阵作为特征矩阵分解出系数矩阵,是由线性组合而成的概念矩阵(或者基底),则可以看成在R概念空间投影成的坐标,含有的结构信息。所以的近似(因为概念空间的维度减少有可能丢失的信息)分解如下: , , 相应的目标函数为: Graph Regularized Nonnegative MatrixFactorization for Data Representation - Cai, 2011 上面的CF虽然可以接受负的输入,但是CF仍然不能检测出数据的固有结构,因此还需引入图正规化(Graph Regularizer)来最逼近数据原有的结构。 使用图正规化得先定义数据的关系矩阵, 然后熟悉的graph Laplacian 再次出现了,有正则化项: 这里讨论GR的优点,GR选取样本点最近的P个邻域点进行正则化,可以保留数据点的相似结构(局部联系)。由上式第一个等式可知,最小化的过程中系数矩阵是固定的,只取最接近的点,这说明了样本空间中相邻的映射在特征空间中的点也同样相邻(因为大)。 同样重要的是,即使距离度量取得不合适,GR也能根据来削小其带来的误差。对于下图分布的数据,取欧式距离是不合适的。但是系数矩阵约束出来数据邻域的能保证欧式距离在小范围内适用。总的来说,GR是个好东西,提取了数据的原有结构。 问题还有一个,就是所用的系数矩阵是预定义的(predefined),会受输入数据的影响。所以作者再提出了一个自适应邻域结构的概率系数矩阵规则。鉴于上面距离近的数据点系数大(成为邻域点的可能性大),于是有: 其中,是防止概率1全分配给最近距离点的平凡解出现。至此该算法的建模部分就完整了。 不过评估部分显示NMF的效果比CF的要好得多(可能数据集原因)因此可考虑NMF的SRAN模型。 1、在聚类过程中判定簇的数目; 2、能在聚类后继续在子类中划分亚型; 3、提出一个PIN框架,能跟其他算法灵活结合; 1、添加数据扰动的做法欠妥,因为特征变量的方差不一定能准确还原数据的扰动。 ⚪Perturbation clustering Partition the patients using all possible number with K-means, have (K-1) partitions , then build the connectivity matrix *Then generating H perturbed dataset by adding Gaussian noise to original data E. , (这里加入特征中值方差的高斯噪声避免了噪声过小扰动不充分或者过大破坏数据结构的问题,同时起到了泛化数据的作用,个人认为在一定程度上减弱了维度灾难的影响) Then build the connectivity matrix , and perturbed connected connectivity matrix stability assessment Calculate the difference matrix , the more this distribution shift to 1, the less robust the clustering is. Then compute the cumulative distribution function(CDF), and calculate the area() under the curve of CDF . Choose the optimal . 由于最优分类数受扰动的影响较少,差异矩阵的非零项较小,CDF曲线会较快跳至1,其AUC曲线面积也最大,因此这里能初步学出数据的最优类数以及最优划分。 *这里相当于把添加扰动得到的关系矩阵作为金标准,来求出AUC。 ⚪Subtyping multi-omic data Step 1-data integration and subtyping Input T data types matrices, then construct T original connectivity matrices and T perturbed matrices , and get (by k-means) Hence we have combined similarity matrix , combined perturbed matrices . represents the distance between patients, then dynamic tree cut, hierarchical clustering, partitioning around medoids can be used with pair-wise distances. & can determine the cluster number for HC and PAM. At last, similar to the pair-wise agreement of Rand Index, we calculate the agreement between the data types , if agree(Sc) >50%, say the T data types have a strong agreement. Finally, we choose the result of cluster algorithm that has the highest agreement. Step 2-further splitting discovered groups Case One When the connectivity of data type are consistent in step 1(i.e. agree(Sc)>50%), then check the consistency within each group with the same procedure of step 1, further split the group if the optimal partitionings are strongly agree. Case Two When the data types are not consistent, we avoid unbalanced clustering by attempting to further split each group based on two conditions. First, normalized entropy evaluates the balanced rate of group if , with , . *Second, we use gap statistic to ckeck if the data can be further clustered. . If gap statistic return 1, then we have no enough evidence to separate the group. 优点:1、整合数据通过融合样本的相似性网络:(1)能从小样本中派生出有用的信息;(2)对选择偏差、数据噪声鲁棒;(3)提炼数据中的一致、互补信息。 缺点:1、通过eigengap确定类别数目,局限性较大;2、邻域数目的取法有待改善;3、算法缺乏关键特征的提取能力,容易融入冗余特征的关系。 ⚪标准化数据 ⚪计算关系矩阵S、归一化关联矩阵(全局以及局部) 首先求样本的正规化指数核, 用于消除缩放问题,则是调节缩放的超参(0.3-1) 然后,求取样本全局的关联矩阵, 把自相关度区分开来讨论是为了避免其远大于其他相似度而影响到关联矩阵的稳定性的问题。 最后,再确定样本的局部关联矩阵 ⚪网络融合 对于m 组源的数据集来,关联矩阵的融合为,如此迭代知道P 收敛() 1、Silhouettes(评价划分聚类的紧致程度&指示合适的类别数) 2、NMI 3、Cox regression model 确定聚类数目的两种方法(源自Spectral Clustering) 1、eigengap 2、L. Zelnik-2005 Self-tuning spectral clustering.
⚪SNMNMF,2011(multi-dimensions & network data)
⚪SMBPLS,2012(multi-dimensions labeled data)
PLS
⚪SNPLS,2016
#多视角聚类模块
(MVAN)Multi-View Clustering and Semi-Supervised Classification with Adaptive Neighbours - Nie, 2017
Motivation
Background
Modulation
Demodulation
Parameter Analysis
Debug test
(SWMV) Self-weighted multiview clustering with multiple graphs - Nie, 2017
(CLR) Constrained Laplacian Rank - Nie, 2016
(MVDMF)Multi-View Clustering via Deep Matrix Factorization - Zhao, 2017
Motivation
Background
Modulation
Demudulation
Debug test
(MVLRMF)Multi-View Spectral Clustering via Structured Low-Rank Matrix Factorization - Wang, 2018
Modeling
Demodulation
*Accounting for tumor purity improve cancer subtype classification - Zhang, 2017
Background
Purpose
Modeling
Evaluated metrics
(SRAN)Self-Representative Manifold Concept Factorization with Adaptive Neighbors for Clustering - MA,2018
Purpose
Modeling
Evaluation
(PIN)Perturbation clustering for data integration - Tin, 2017
Purpose
Room for improvement
Modeling
(SNF)Similarity network fusion for data integration - Wang, 2014
总结
Modeling
Evaluation Metrics
Supplement
(CC) Consensus Clustering: A Resampling-Based Method for class Discovery - Monti, 2003
(SRF) Simultaneous discovery of cancer subtypes and subtype features by molecular data integration - Thanh, 2016
(RMKL)
