监控:
传感器:
    数据采集  --> 数据存储  --> 数据展示
    报警:采集到的数据超出阈值
        时间序列数据

    开源监控工具:

    SNMP:Simple Network Managent Protocol
    SNMP的工作模式:
        NMS向agent采集数据
            agent向NMS报告数据
            NMS请求agent修改配置

    SNMP的组件:
        MIB: management information base 管理信息库
            SMI:MIB表示符号
            SNMP协议:

    SNMP协议的版本:
        v1, v2, v3
        v2c:NMS --> agent
            v3:认真、加密、解密

    Linux: net-snmp 程序包

    NMS可发起操作:
        Get, GetNext, Set, Trap

            agent:Response

            UDP
                NMS:161
                    agent:162

            OID: 对象标识符

    agent:代理
分布式监控
著名的开源监控工具:zabbix, znnos, opennms, cacti, nagios(icinga), ganglia
监控功能的实现:
agent
ssh
SNMP
IPMI
只会平台管理接口(Intelligent Platform Management Interface)原本是一种Intel架构的企业系统的周边设备所采用的一种工业标准,IPMI亦是一个开放的免费标准。使用者无需支付额外的费用饥渴使用此标准。
zabbix:有专用agent的监控工具
监控主机:
Linux、Windows、FreeBSD
网络设备:
SNMP,SSH(并非所有)
可监控对象:
设备/软件
设备:服务器、路由器、交换机、IO系统
软件:OS、网络、应用程序
偶发性小故障:
主机down机、服务不可用、主机不可达
严重故障:
主机性能指标:
趣事:时间序列数据
数据存储:
cacti:rrd(round robin database)
zabbix:mysql,pgsql
zabbix架构中的组件:
zabbix-server:C语言
OS:zabiix-agent:C语言
zabbix-web:GUI,用于实现zabbix设定和展示
zabbix-proxy:分布式监控环境中的专用组件
zabbix-database:MySQL,PGSQL(postgreSQL)、Oracle、DB2、SQLitezabbix产生的数据主要由四部分组成:
配置数据
历史数据:50bytes
历史趋势数据:128bytes
事件数据:130bytes
自动化监控:
What to monitor?
Devices/Software
Server,Router,Switchs,I/O systems etc.
Operating System,Networks,Applications,etc.
Incidents
DB down,Replication stopped,Server not reachable,etc.
Critical Events
Disk more than n% full or less than m Gbyte free,
Replication more than n seconds logging,Data node down,
100% CPU utilization,etc
Alert,immediate intervention,fire fighting
Trends(includes timel)
Graphs
How long does it take until
my disk is full?
my Index Memory is filled up?
When does it happen?
Peak? Backup?
How often does it happen? Does it happen periodically?
Once a day? Always at Sunday night?
How does it correlate to other informations?
I/O problems during our backup window?
Reading the patterns!
this can help us to find the root cause of problems
Basic solutions:
top, vmstat, iostat, mytop, innotop, SHOW GLOBAL
STATUS, SHOW INNODB STATUS
CLI, no graphs, no log term information,but good for adhoc analysisl
Graphical solutions
Nagios(Opsview, Icinga), Cacti, Zabbix,
Typically NOT specialised in DB monitoring
How Zabbix is progressing?
Why use monitoring solution?
What are the functionalities of MS?
Ddata gathering
Gathered using various methods, including SNMP, native agents, IPMI and others
Alerting
Gathered data can be compared data can be compared to thresholds and alerts sent out using different channels like e-mail or SMS
Data storage
Once we have gathered the data it doesn't make sense to throw it away, so we will often want to store it for later analysis
Visualisation
Humans are better at distinguishing visualised data, especially when there is huge amounts of data
What is Zabbix?
The Enterprise-class Monitoring Solution
Why choose Zabbix?
Zabbix is an enterprise level monitoring software
Scales up-to 100 000 of monitored devices
Distributed monitoring
Supports virtually all platforms and methods of monitoring
True Open Source, no proprietary add-ons, and no "professional" or "enterprise" versions
Estimated number of users is more than 40 000, but could be several times greater
Which platforms does Zabbix support?
Various Monitoring Functions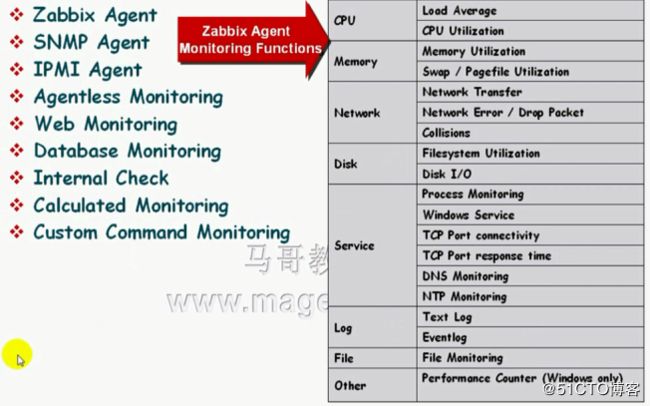
What can be monitored on the Web?
Respanse time
Download speed
Response code
Availability of certain content
Complex web scenarios with login and logout capability
Support for HTTP and HTTPs
How you get notified?
Zabbix Proxy
Zabbix architecture
Zabbix architecture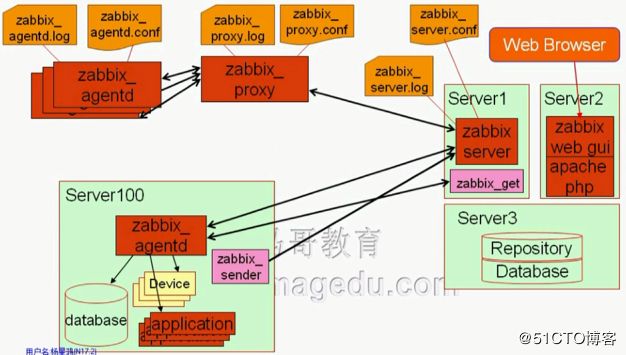
Zabbix常用的术语
主机(host):要监控的网络设备,可由IP或DNS名称指定;
主机组(host group):主机饿逻辑容器,可以包含主机和模板,但一个组内的主机和模板不能相互链接;主机组通常在给用户或用户组指派监控权限时使用;
监控项(item):一个特定监控指标的相关的数据,这些数据来自于被监控对象;对于item是zabbix进行数据收集的核心,没有item,将没有数据;相对某监控对象来说,每个item都由"key"进行标识;
触发器(trigger):一个表达式,用于评估某监控对象的某特定item内所接收到的数据是否在合理范围内,即阀值;接收到的数据量大于阀值时,触发器状态将从"OK"转变为"Problem",当数据量再次回归到合理范围时,其状态将从"Problem"转换回"OK";
事件(event):即发生的一个值得关注的事情,例如触发器的状态转变,新的agent或重新上线的agent的自动注册等;
动作(action):指对于特定事件事先定义的处理方法,通过包含操作(如发送通知)和条件(何时执行操作);
报警升级(escalation):发送警报或制定远程命令的自定义方案,如每隔5分钟发送一次警报,共发送5次等;
媒介(media):发送通知的手段或通道,如Email、Jabber或SMS等;
通知(notification):通过选定的媒介向用户发送的有关某事件的信息;
远程命令(remote command):预定义的命令,可在被监控主机处于某特定条件下时自动执行;
模板(template):用于快速定义被监控主机的预设条目集合,通常包含了item、trigger、graph、screen、application以及low-level discovery rule;模板可以直接链接至单个主机;
应用(application):一组item的集合;
web场景(web scennario):用于检测web站点可用性的一个或多个HTTP请求;
前端(frontend):Zabbix的web接口;
Zabbix的逻辑架构
Zabbix Server Processes
Requirements
Hardware Examples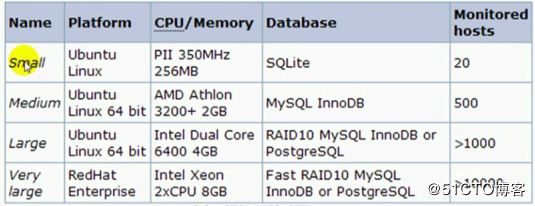
Software - DBMS
Software - Frontend
Software - Server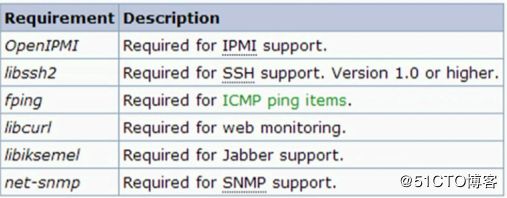
Install Zabbix
Create zabbix user
Untar source tarball
Create zabbix database and populate it
A MySQL(PostgreSQL,...) installation is needed...
./config ; make ; make install
Some packages may be missing...
Does not take too long (< 10 min)
Create configuration file for zabbix server
(misc/conf/zabbix_server.conf)
Start the zabbix server
Install the Zabbix web interface
Apache/PHP is required
Copy PHP file to $DocumentRoot/zabbix
http://localhost/zabbix
Change php.ini
Default settings are by far not enough!
data.timezone = Asia/Shanghai
Restart webserver
Finish configuration
Login with admin/zabbix
实验环境:
主机名称:node1.smoke.com master
操作系统:CentOS 6.5
内核版本:2.6.32-504.el6.x86_64
网卡1:vmnet0 172.16.100.7
网卡2:vmnet8 dhcp
主机名称:node2.smoke.com
操作系统:CentOS 6.5
内核版本:2.6.32-504.el6.x86_64
网卡1:vmnet0 172.16.100.8
网卡2:vmnet8 dhcp
主机名称:node3.smoke.com
操作系统:Windows xp
网卡1:172.16.100.9
系统配置:
node1:zabbix-server
[root@node1 ~]# hostname
node1.smoke.com
[root@node1 ~]# ip addr show
1: lo:  mtu 65536 qdisc noqueue state UNKNOWN
    link/loopback 00:00:00:00:00:00 brd 00:00:00:00:00:00
    inet 127.0.0.1/8 scope host lo
    inet6 ::1/128 scope host
       valid_lft forever preferred_lft forever
2: eth0:  mtu 1500 qdisc pfifo_fast state UP qlen 1000
    link/ether 00:0c:29:99:d9:9e brd ff:ff:ff:ff:ff:ff
    inet 172.16.100.7/24 brd 172.16.100.255 scope global eth0
    inet6 fe80::20c:29ff:fe99:d99e/64 scope link
       valid_lft forever preferred_lft forever
3: eth1:  mtu 1500 qdisc pfifo_fast state UP qlen 1000
    link/ether 00:0c:29:99:d9:a8 brd ff:ff:ff:ff:ff:ff
    inet 192.168.243.145/24 brd 192.168.243.255 scope global eth1
    inet6 fe80::20c:29ff:fe99:d9a8/64 scope link
       valid_lft forever preferred_lft forever
[root@node1 ~]# ip route show
172.16.100.0/24 dev eth0  proto kernel  scope link  src 172.16.100.7
192.168.243.0/24 dev eth1  proto kernel  scope link  src 192.168.243.145
169.254.0.0/16 dev eth0  scope link  metric 1002
169.254.0.0/16 dev eth1  scope link  metric 1003
default via 192.168.243.2 dev eth1
[root@node1 ~]# crontab -l
*/5 * * * * /usr/sbin/ntpdate time.nist.gov &> /dev/null
[root@node1 ~]# vim /etc/hosts
172.16.100.7   node1.smoke.com node1
172.16.100.8   node2.smoke.com node2
172.16.100.9   node3.smoke.com node3
node2:linux-agent
[root@node2 ~]# hostname
node2.smoke.com
[root@node2 ~]# ip addr show
1: lo:  mtu 65536 qdisc noqueue state UNKNOWN
    link/loopback 00:00:00:00:00:00 brd 00:00:00:00:00:00
    inet 127.0.0.1/8 scope host lo
    inet6 ::1/128 scope host
       valid_lft forever preferred_lft forever
2: eth0:  mtu 1500 qdisc pfifo_fast state UP qlen 1000
    link/ether 00:0c:29:d6:6a:92 brd ff:ff:ff:ff:ff:ff
    inet 172.16.100.8/24 brd 172.16.100.255 scope global eth0
    inet6 fe80::20c:29ff:fed6:6a92/64 scope link
       valid_lft forever preferred_lft forever
3: eth1:  mtu 1500 qdisc pfifo_fast state UP qlen 1000
    link/ether 00:0c:29:d6:6a:9c brd ff:ff:ff:ff:ff:ff
    inet 192.168.243.146/24 brd 192.168.243.255 scope global eth1
    inet6 fe80::20c:29ff:fed6:6a9c/64 scope link
       valid_lft forever preferred_lft forever
[root@node2 ~]# ip route show
172.16.100.0/24 dev eth0  proto kernel  scope link  src 172.16.100.8
192.168.243.0/24 dev eth1  proto kernel  scope link  src 192.168.243.146
169.254.0.0/16 dev eth0  scope link  metric 1002
169.254.0.0/16 dev eth1  scope link  metric 1003
default via 192.168.243.2 dev eth1
[root@node2 ~]# crontab -l
*/5 * * * * /usr/sbin/ntpdate time.nist.gov &> /dev/nulll
[root@node2 ~]# vim /etc/hosts
172.16.100.7   node1.smoke.com node1
172.16.100.8   node2.smoke.com node2
172.16.100.9   node3.smoke.com node3
node3:windows-agent
安装mariadb:
node1:zabbix-server
[root@node1 ~]# tar xf cmake-2.8.8.tar.gz
[root@node1 ~]# cd cmake-2.8.8
[root@node1 cmake-2.8.8]# ./bootstrap
[root@node1 cmake-2.8.8]# make && make install
[root@node1 cmake-2.8.8]# cd
[root@node1 ~]# groupadd -g 306 -r mysql
[root@node1 ~]# useradd -u 306 -g mysql -r -s /sbin/nologin mysql
[root@node1 ~]# mkdir /mydata/data -pv
[root@node1 ~]# yum -y install readline-devel zlib-devel openssl-devel
[root@node1 ~]# tar xf mariadb-10.0.10.tar.gz
[root@node1 ~]# cd mariadb-10.0.10
[root@node1 mariadb-10.0.10]# cmake . -DCMAKE_INSTALL_PREFIX=/usr/local/mysql \
> -DMYSQL_DATADIR=/mydata/data \
> -DWITH_INNOBASE_STORAGE_ENGINE=1 \
> -DWITH_ARCHIVE_STORAGE_ENGINE=1 \
> -DWITH_BLACKHOLE_STORAGE_ENGINE=1 \
> -DWITH_READLINE=1 \
> -DWITH_SSL=system \
> -DWITH_ZLIB=system \
> -DWITH_LIBWRAP=0 \
> -DMYSQL_UNIX_ADDR=/tmp/mysql.sock \
> -DDEFAULT_CHARSET=utf8 \
> -DDEFAULT_COLLATION=utf8_general_ci
[root@node1 mariadb-10.0.10]# make && make install
[root@node1 mariadb-10.0.10]# cd /usr/local/mysql/
[root@node1 mysql]# chgrp mysql ./*
[root@node1 mysql]# chown mysql:mysql /mydata/data
[root@node1 mysql]# scripts/mysql_install_db --user=mysql --datadir=/mydata/data
[root@node1 mysql]# cp support-files/mysql.server /etc/rc.d/init.d/mysqld
[root@node1 mysql]# chmod +x /etc/rc.d/init.d/mysqld
[root@node1 mysql]# chkconfig --add mysqld
[root@node1 mysql]# mv /etc/my.cnf /etc/my.cnf.bak
[root@node1 mysql]# cp support-files/my-large.cnf /etc/my.cnf
[root@node1 mysql]# vim /etc/my.cnf
log-bin=/mydata/binlogs/master-bin
innodb_file_per_table = ON
[root@node1 mysql]# mkdir -pv /mydata/binlogs/
[root@node1 mysql]# chown -R mysql.mysql /mydata/binlogs/
[root@node1 mysql]# service mysqld start
[root@node1 mysql]# vim /etc/profile.d/mysqld.sh
export PATH=/usr/local/mysql/bin:$PATH
[root@node1 mysql]# . /etc/profile.d/mysqld.sh
[root@node1 mysql]# mysql
Welcome to the MariaDB monitor.  Commands end with ; or \g.
Your MariaDB connection id is 4
Server version: 10.0.10-MariaDB-log Source distribution

Copyright (c) 2000, 2014, Oracle, SkySQL Ab and others.

Type 'help;' or '\h' for help. Type '\c' to clear the current input statement.

MariaDB [(none)]> use mysql
Database changed
MariaDB [mysql]> SELECT user,host,password FROM user;
+------+-----------------+----------+
| user | host            | password |
+------+-----------------+----------+
| root | localhost       |          |
| root | node1.smoke.com |          |
| root | 127.0.0.1       |          |
| root | ::1             |          |
|      | localhost       |          |
|      | node1.smoke.com |          |
+------+-----------------+----------+
6 rows in set (0.00 sec)

MariaDB [mysql]> DROP USER ""@'localhost';
Query OK, 0 rows affected (0.00 sec)

MariaDB [mysql]> DROP USER ""@'node1.smoke.com';
Query OK, 0 rows affected (0.00 sec)

MariaDB [mysql]> \q
Bye
安装zabbix:
node1:zabbix-server
[root@node1 mysql]# mysql
Welcome to the MariaDB monitor.  Commands end with ; or \g.
Your MariaDB connection id is 6
Server version: 10.0.10-MariaDB-log Source distribution

Copyright (c) 2000, 2014, Oracle, SkySQL Ab and others.

Type 'help;' or '\h' for help. Type '\c' to clear the current input statement.

MariaDB [(none)]> CREATE DATABASE zabbix CHARACTER SET utf8;
Query OK, 1 row affected (0.01 sec)

MariaDB [(none)]> GRANT ALL on zabbix.* TO 'zbxuser'@'172.16.%.%' IDENTIFIED BY 'zbxpass';
Query OK, 0 rows affected (0.00 sec)

MariaDB [(none)]> GRANT ALL on zabbix.* TO 'zbxuser'@'node1.smoke.com' IDENTIFIED BY 'zbxpass';
Query OK, 0 rows affected (0.01 sec)

MariaDB [(none)]> FLUSH PRIVILEGES;
Query OK, 0 rows affected (0.00 sec)

MariaDB [(none)]> \q
Bye
[root@node1 mysql]# cd /root/zabbix-2.4/
[root@node1 zabbix-2.4]# ls
zabbix-2.4.0-1.el6.x86_64.rpm               zabbix-proxy-pgsql-2.4.0-1.el6.x86_64.rpm    zabbix-web-2.4.0-1.el6.noarch.rpm
zabbix-agent-2.4.0-1.el6.x86_64.rpm         zabbix-proxy-sqlite3-2.4.0-1.el6.x86_64.rpm  zabbix-web-japanese-2.4.0-1.el6.noarch.rpm
zabbix-get-2.4.0-1.el6.x86_64.rpm           zabbix-sender-2.4.0-1.el6.x86_64.rpm         zabbix-web-mysql-2.4.0-1.el6.noarch.rpm
zabbix-java-gateway-2.4.0-1.el6.x86_64.rpm  zabbix-server-2.4.0-1.el6.x86_64.rpm         zabbix-web-pgsql-2.4.0-1.el6.noarch.rpm
zabbix-proxy-2.4.0-1.el6.x86_64.rpm         zabbix-server-mysql-2.4.0-1.el6.x86_64.rpm
zabbix-proxy-mysql-2.4.0-1.el6.x86_64.rpm   zabbix-server-pgsql-2.4.0-1.el6.x86_64.rpm
[root@node1 zabbix-2.4]# yum -y install zabbix-server-2.4.0-1.el6.x86_64.rpm zabbix-server-mysql-2.4.0-1.el6.x86_64.rpm zabbix-get-2.4.0-1.el6.x86_64.rpm zabbix-2.4.0-1.el6.x86_64.rpm zabbix-web-2.4.0-1.el6.noarch.rpm zabbix-web-mysql-2.4.0-1.el6.noarch.rpm zabbix-agent-2.4.0-1.el6.x86_64.rpm zabbix-sender-2.4.0-1.el6.x86_64.rpm
安装报错:
Error: Package: zabbix-server-mysql-2.4.0-1.el6.x86_64 (/zabbix-server-mysql-2.4.0-1.el6.x86_64)
           Requires: libiksemel.so.3()(64bit)
Error: Package: zabbix-server-2.4.0-1.el6.x86_64 (/zabbix-server-2.4.0-1.el6.x86_64)
           Requires: iksemel
Error: Package: zabbix-server-2.4.0-1.el6.x86_64 (/zabbix-server-2.4.0-1.el6.x86_64)
           Requires: fping
 You could try using --skip-broken to work around the problem
 You could try running: rpm -Va --nofiles --nodigest

[root@node1 ~]# ls *.rpm
fping-2.4b2-10.el6.x86_64.rpm  iksemel-1.4-2.el6.x86_64.rpm  iksemel-devel-1.4-2.el6.x86_64.rpm  libiksemel3-1.4-2_2.el6.x86_64.rpm
[root@node1 ~]# yum localinstall  iksemel-1.4-2.el6.x86_64.rpm iksemel-devel-1.4-2.el6.x86_64.rpm fping-2.4b2-10.el6.x86_64.rpm
配置zabbix:
node1:zabbix-server
[root@node1 ~]# service httpd start
[root@node1 ~]# cd /usr/share/doc/zabbix-server-mysql-2.4.0/create/
[root@node1 create]# ls
data.sql  images.sql  schema.sql
[root@node1 create]# mysql zabbix < schema.sql    #导入数据库要有顺序,先schema、images、data;
[root@node1 create]# mysql zabbix < images.sql
[root@node1 create]# mysql zabbix < data.sql
[root@node1 ~]# vim /etc/zabbix/zabbix_server.conf
DBHost=172.16.100.7
DBUser=zbxuser
DBPassword=zbxpass
DBSocket=/tmp/mysql.sock
[root@node1 ~]# service zabbix-server start
[root@node1 ~]# ss -tnl
State       Recv-Q Send-Q                            Local Address:Port                              Peer Address:Port
LISTEN      0      128                                          :::22                                          :::*
LISTEN      0      128                                           *:22                                           *:*
LISTEN      0      128                                          :::10051                                       :::*
LISTEN      0      128                                           *:10051                                        *:*
LISTEN      0      128                                           *:3306                                         *:*
LISTEN      0      128                                          :::80                                          :::*
[root@node1 ~]# vim /etc/php.ini
date.timezone = Asia/Chongqing
[root@node1 ~]# service httpd restart
配置zabbix-web:
通过windows的浏览器输入172.16.100.7/zabbix;
点击next,所有检查通过,点击next,配置数据库连接,数据库主机172.16.100.7、数据库用户zbxuser、密码zbxpass,点击next;
配置zabbix主机地址172.16.100.7,name为node1.smoke.com,点击next,到finish,自动跳转到zabbix登录界面;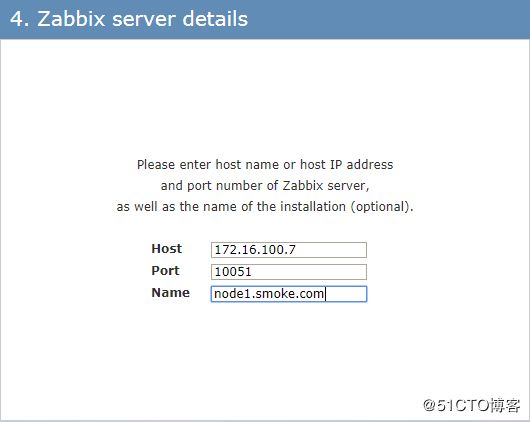
默认账号admin,密码zabbix;
zabbix-server监控自己:
node1:zabbix-server
[root@node1 ~]# vim /etc/zabbix/zabbix_agentd.conf
Server=127.0.0.1,172.16.100.7
ServerActive=127.0.0.1,172.16.100.7
Hostname=node1.smoke.com
[root@node1 ~]# service zabbix-agent start
[root@node1 ~]# ss -tnl
State       Recv-Q Send-Q                            Local Address:Port                              Peer Address:Port
LISTEN      0      128                                          :::22                                          :::*
LISTEN      0      128                                           *:22                                           *:*
LISTEN      0      128                                          :::10050                                       :::*
LISTEN      0      128                                           *:10050                                        *:*
LISTEN      0      128                                          :::10051                                       :::*
LISTEN      0      128                                           *:10051                                        *:*
LISTEN      0      128                                           *:3306                                         *:*
LISTEN      0      128                                          :::80                                          :::*
在zabbix-web上面启用对node1.smoke.com的监控,点击Configuration--Hosts,默认zabbix-server已经把自己监控了,点击Disable启用本机监控;
zabbix-server监控linux-agent:
node2:linux-agent
[root@node2 ~]# cd zabbix-2.4/
[root@node2 zabbix-2.4]# yum install zabbix-2.4.0-1.el6.x86_64.rpm zabbix-agent-2.4.0-1.el6.x86_64.rpm zabbix-sender-2.4.0-1.el6.x86_64.rpm
[root@node2 zabbix-2.4]# vim /etc/zabbix/zabbix_agentd.conf
Server=172.16.100.7
ServerActive=172.16.100.7
Hostname=node2.smoke.com
[root@node2 zabbix-2.4]# service zabbix-agent start
在zabbix-web上面添加linux-agent主机监控,点击Configuration--Hosts--Create-host,填写完成,点击Add;
Host:主机
Host name:主机名,172.16.100.8;
Visible name:node2.smoke.com
New group:创建组
Agent interfaces:IP address 172.16.100.8,Connect to 选择IP,Port 默认10050
SNMP interfaces:通过snmp监控
JMX interfaces:监控java;
IPMI interfaces:监控服务器硬件;
Monitored by proxy:是否使用代理,no proxy
Templates:模板;
IPMI:监控硬件
Macros:宏,变量;
Host inventory:资产清单
点击Monitoring--Graphs(图形),Group选择all,Host选择all,Graph选择Zabbix data qathering process busy %;
点击Monitoring--Screens,可以自定义多张图片显示在一张页面;