简介
IsolationForest(孤立森林)适用于大规模数据,应用于网络安全的攻击检测和流量异常,以及金融机构的欺诈行为。
IsolationForest 两大步骤
1、从训练集中抽样,构建iTree
2、对iForest中的每颗iTree进行测试,记录path length,然后根据异常分数计算公式,计算每条测试数据的anomaly score
IsolationForest建模原则
1、异常数据只占少量
2、异常数据特征值与正常值相差很大
算法只需两个参数
1、树的多少(一般100就比较好了)
2、抽样多少(一般256就比较好了)
模型注意事项:
1、模型预测结果为1和-1,其中1为正常值,而-1为异常值;
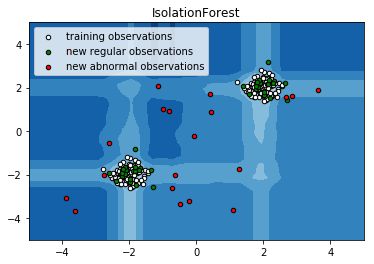
2、当异常数据太少了,模型训练集只有正常数据时,也是可行的,但是预测结果会降低(如下面的例子)。
举例:
import numpy as np
import matplotlib.pyplot as plt
from sklearn.ensemble import IsolationForest

rng = np.random.RandomState(42)

# 生成训练集
X = 0.3 * rng.randn(100, 2)
X_train = np.r_[X + 2, X - 2]
# 生成一些常规的新奇观察
X = 0.3 * rng.randn(20, 2)
X_test = np.r_[X + 2, X - 2]
# 产生一些异常新颖的观察
X_outliers = rng.uniform(low=-4, high=4, size=(20, 2))
#X_outliers.max()

# fit训练
clf = IsolationForest(max_samples=100, random_state=rng)
clf.fit(X_train)

#predict预测
y_pred_train = clf.predict(X_train)
y_pred_test = clf.predict(X_test)
y_pred_outliers = clf.predict(X_outliers) #预测结果应该全是异常值

# plot画图
xx, yy = np.meshgrid(np.linspace(-5, 5, 50), np.linspace(-5, 5, 50))
Z = clf.decision_function(np.c_[xx.ravel(), yy.ravel()]) #CLF模型框架
Z = Z.reshape(xx.shape)

plt.title("IsolationForest")
plt.contourf(xx, yy, Z, cmap=plt.cm.Blues_r)

b1 = plt.scatter(X_train[:, 0], X_train[:, 1], c='white',
             s=20, edgecolor='k')
b2 = plt.scatter(X_test[:, 0], X_test[:, 1], c='green',
             s=20, edgecolor='k')
c = plt.scatter(X_outliers[:, 0], X_outliers[:, 1], c='red',
            s=20, edgecolor='k')
plt.axis('tight')
plt.xlim((-5, 5))
plt.ylim((-5, 5))
plt.legend([b1, b2, c],
       ["training observations",
        "new regular observations", "new abnormal observations"],
       loc="upper left")
plt.show()
学习案例
http://scikit-learn.org/stable/auto_examples/ensemble/plot_isolation_forest.html#sphx-glr-auto-examples-ensemble-plot-isolation-forest-py
