加载所需R包
# if (!requireNamespace("BiocManager", quietly = TRUE))
#     install.packages("BiocManager")
# BiocManager::install("ggtree", version = "3.8")
library(ggplot2)
library(ggtree)
设置工作路径
setwd("~/Desktop/SpeciesTree_test/animal/")
# 清除当前环境中的变量
rm(list=ls())
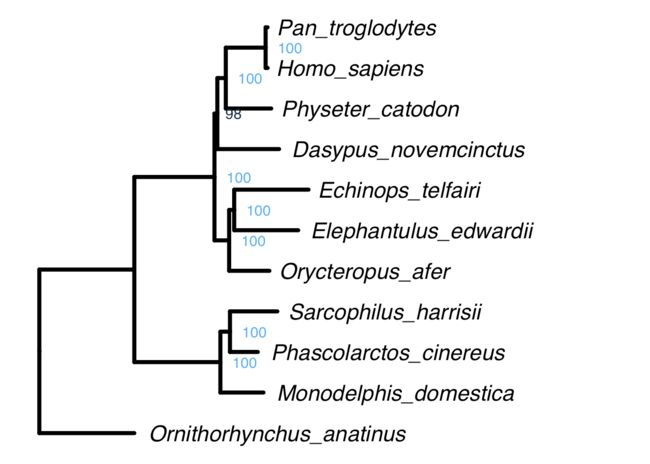
读取nwk格式的树文件并进行可视化
tree <- read.newick("Concatenation/cds/RAxML_bipartitions.concatenation_out.nwk",node.label = "support")
# 显示节点标签和bootstrap值
ggtree(tree,color="black",linetype=1,size=1.5,ladderize = T) +
  geom_tiplab(hjust = -0.05,size=6,fontface="italic") + xlim(NA,0.8) +
  geom_text2(aes(subset=!isTip,label=support,color=support, hjust=-0.5),size=4)
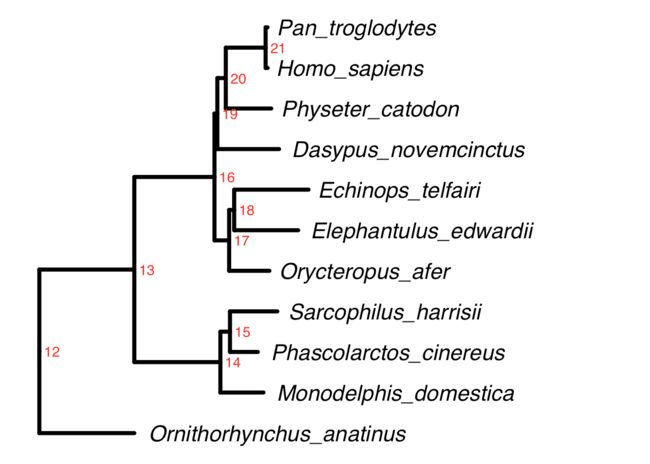
# 显示节点标签和内部节点的编号
ggtree(tree,color="black",linetype=1,size=1.5,ladderize = T) +
  geom_tiplab(hjust = -0.05,size=6,fontface="italic") + xlim(NA,0.8) +
  geom_text2(aes(subset=!isTip,label=node),hjust=-.3,color="red")
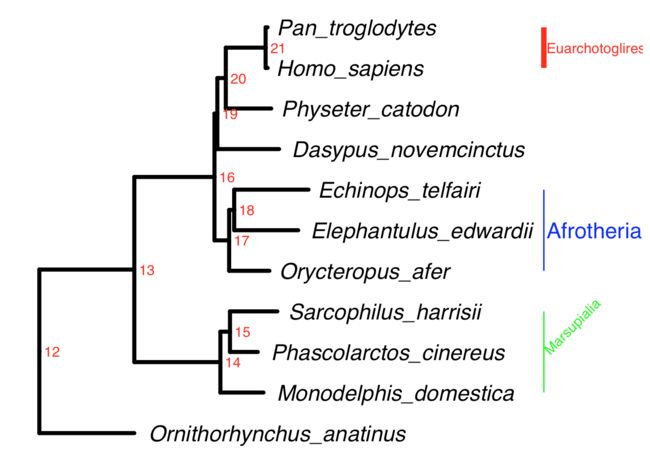
# 标记指定内部节点对应的clade
ggtree(tree,color="black",linetype=1,size=1.5,ladderize = T) +
  geom_tiplab(hjust = -0.05,size=6,fontface="italic") + xlim(NA,0.8) +
  geom_text2(aes(subset=!isTip,label=node),hjust=-.3,color="red") +
  geom_cladelabel(node=21, label = "Euarchotoglires", align = T, offset = 0.32, color = "red", barsize = 2) +
  geom_cladelabel(node=17, label = "Afrotheria", align = T, offset = 0.32, color = "blue",fontsize = 6) +
  geom_cladelabel(node=14, label = "Marsupialia", align = T, offset = 0.32, color = "green",angle = 45)
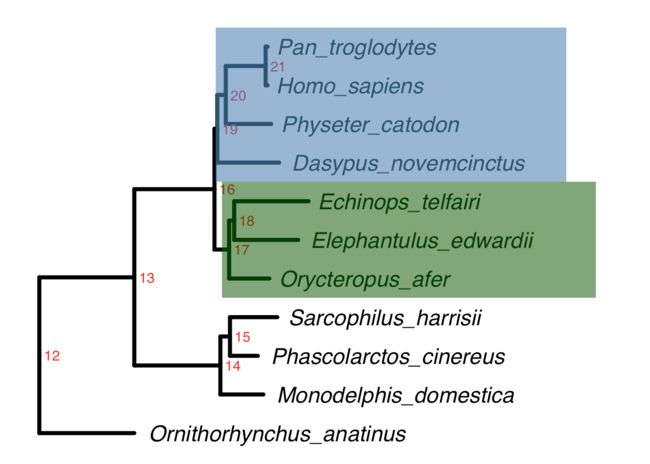
# 高亮指定内部节点对应clade所在的区域
ggtree(tree,color="black",linetype=1,size=1.5,ladderize = T) +
  geom_tiplab(hjust = -0.05,size=6,fontface="italic") + xlim(NA,0.8) +
  geom_text2(aes(subset=!isTip,label=node),hjust=-.3,color="red") +
  geom_hilight(node=19, fill = "steelblue", alpha = .6, extend = 0.4) +
  geom_hilight(node=17, fill = "darkgreen", alpha = .6, extend = 0.4)
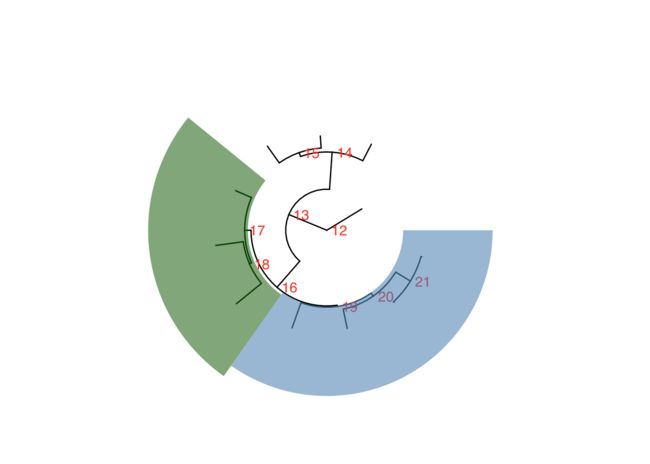
# 高亮环形进化树内部指定节点对应clade所在的区域
ggtree(tree,layout = "circular", color="black",linetype=1)  +
  geom_text2(aes(subset=!isTip,label=node),hjust=-.3,color="red") +
  geom_hilight(node=19, fill = "steelblue", alpha = .6, extend = 0.2) +
  geom_hilight(node=17, fill = "darkgreen", alpha = .6, extend = 0.2)
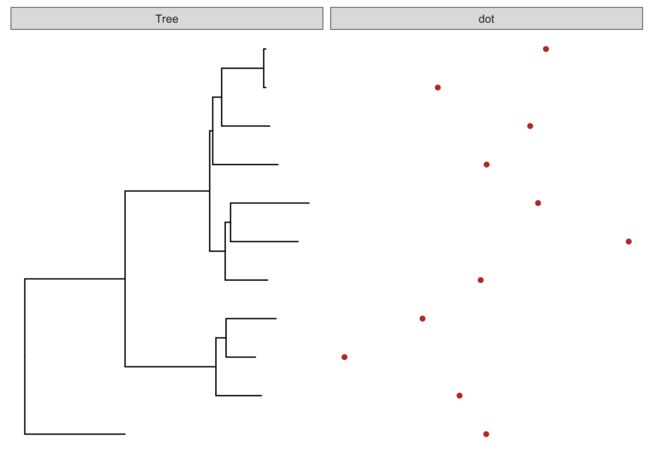
# 构建注释数据信息,并展示不同注释数据类型
d1 <- data.frame(id=tree@phylo$tip.label, val=rnorm(11, sd=3))
head(d1)
p <- ggtree(tree)
p2 <- facet_plot(p, panel="dot", data=d1, geom=geom_point, aes(x=val), color='firebrick')
p2
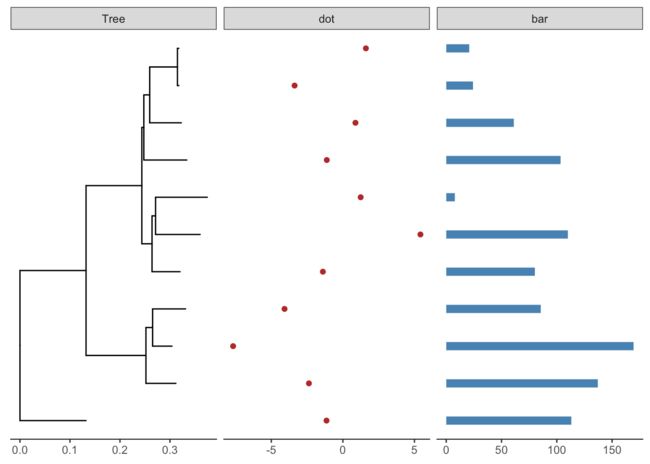
d2 <- data.frame(id=tree@phylo$tip.label, value=abs(rnorm(11, mean=100, sd=50)))
head(d2)
facet_plot(p2, panel='bar', data=d2, geom=geom_segment, aes(x=0, xend=value, y=y, yend=y), size=3, color='steelblue') + theme_tree2()
# 读取BEAST软件分析得到的树文件
file <- system.file("extdata/BEAST", "beast_mcc.tree", package="treeio")
beast <- read.beast(file)
ggtree(beast, aes(color=rate))  +
  geom_range(range='length_0.95_HPD', color='red', alpha=.6, size=2) +
  geom_nodelab(aes(x=branch, label=round(posterior, 2)), vjust=-.5, size=3) +
  scale_color_continuous(low="darkgreen", high="red") +
  theme(legend.position=c(.1, .8))
beast_file <- system.file("examples/MCC_FluA_H3.tree", package="ggtree")
# 读取beast树文件
beast_tree <- read.beast(beast_file)
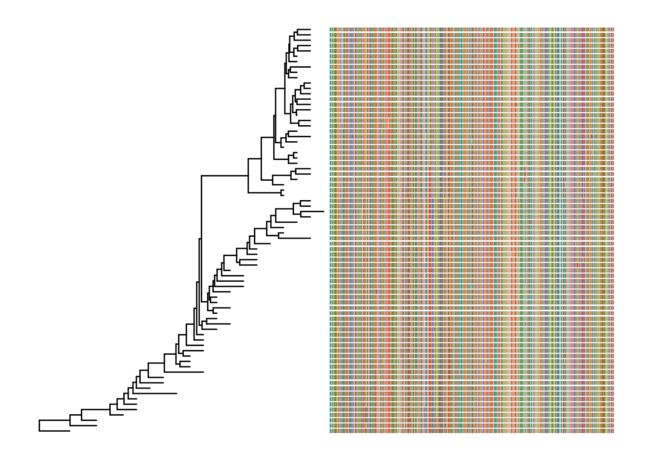
# 读取多序列比对文件
fasta <- system.file("examples/FluA_H3_AA.fas", package="ggtree")
# 展示多序列比对信息
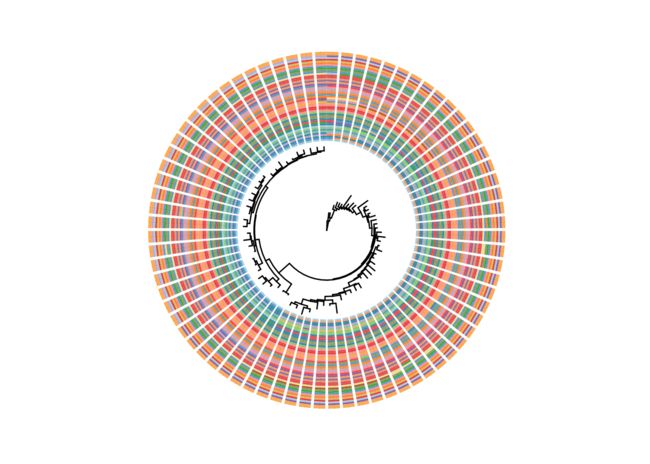
msaplot(ggtree(beast_tree), fasta)
# 环形展示多序列比对信息
msaplot(ggtree(beast_tree), fasta, window=c(150, 200)) + coord_polar(theta='y')
sessionInfo()
## R version 3.5.1 (2018-07-02)
## Platform: x86_64-apple-darwin15.6.0 (64-bit)
## Running under: OS X El Capitan 10.11.3
##
## Matrix products: default
## BLAS: /Library/Frameworks/R.framework/Versions/3.5/Resources/lib/libRblas.0.dylib
## LAPACK: /Library/Frameworks/R.framework/Versions/3.5/Resources/lib/libRlapack.dylib
##
## locale:
## [1] zh_CN.UTF-8/zh_CN.UTF-8/zh_CN.UTF-8/C/zh_CN.UTF-8/zh_CN.UTF-8
##
## attached base packages:
## [1] stats4    parallel  stats     graphics  grDevices utils     datasets
## [8] methods   base
##
## other attached packages:
## [1] Biostrings_2.48.0   XVector_0.20.0      IRanges_2.14.11
## [4] S4Vectors_0.18.3    BiocGenerics_0.26.0 bindrcpp_0.2.2
## [7] ggtree_1.12.7       ggplot2_3.0.0
##
## loaded via a namespace (and not attached):
##  [1] Rcpp_0.12.18     pillar_1.3.0     compiler_3.5.1   plyr_1.8.4
##  [5] bindr_0.1.1      zlibbioc_1.26.0  tools_3.5.1      digest_0.6.16
##  [9] jsonlite_1.5     tidytree_0.1.9   evaluate_0.11    tibble_1.4.2
## [13] gtable_0.2.0     nlme_3.1-137     lattice_0.20-35  pkgconfig_2.0.2
## [17] rlang_0.2.2      rstudioapi_0.7   rvcheck_0.1.0    yaml_2.2.0
## [21] treeio_1.4.3     withr_2.1.2      dplyr_0.7.6      stringr_1.3.1
## [25] knitr_1.20       rprojroot_1.3-2  grid_3.5.1       tidyselect_0.2.4
## [29] glue_1.3.0       R6_2.2.2         rmarkdown_1.10   reshape2_1.4.3
## [33] tidyr_0.8.1      purrr_0.2.5      magrittr_1.5     backports_1.1.2
## [37] scales_1.0.0     htmltools_0.3.6  assertthat_0.2.0 colorspace_1.3-2
## [41] ape_5.1          labeling_0.3     stringi_1.2.4    lazyeval_0.2.1
## [45] munsell_0.5.0    crayon_1.3.4
参考来源:http://www.bioconductor.org/packages/release/bioc/vignettes/ggtree/inst/doc/treeAnnotation.html
