本笔记只做复习以及巩固知识点使用,初次学习请下载练习工作簿,跟随网络课程的讲解同步操作,结果参考解法工作簿。
Filtering for the Top 10
If we want to filter for the top 10 products by sales per region, this analysis can be interpreted two ways:
- Of our overall top 10 products, how do those 10 rank in each region?
or - In each region, which are the top 10 products?
The first is fairly simple, and is shown here.

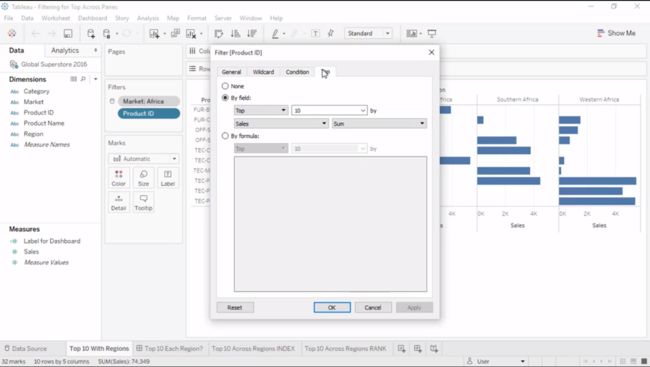
Right clicking on the Product ID filter and selecting Edit Filter, then clicking the Top tab, we see this is Top 10 Product IDs by sum of sales.
But if we’re trying to answer the second scenario, “in each region, which are the top 10 products?”, we might be tempted to build the view we have here, then to put Region onto filter and select whatever Region we’re interested in.
However, this view appears to be giving incorrect responses – despite the fact our Product ID filter says top 10 by Sales, we only have 7 rows. This is a matter of how the filter is being evaluated.
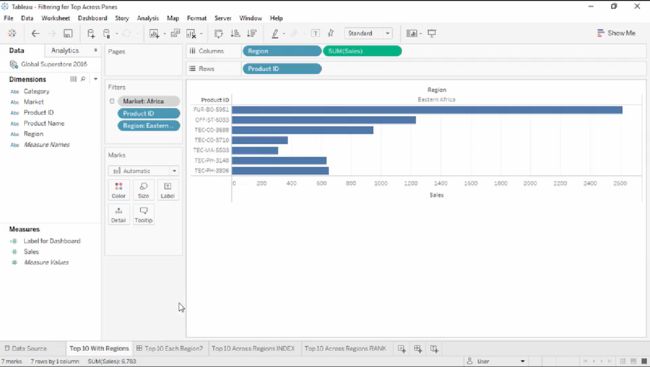
If you’re familiar with SQL, filters are written in the WHERE of the query clause via an AND statement. Therefore, records need to meet all criteria to be returned – For the bar chart here on top, results need to be members of the top 10 of all Products by sales.

And if we filter by Region as well products ALSO need to be sold in that Region. If 3 of the top 10 products aren’t sold in Eastern Africa, the result subset will only contain 7 products. Both conditions of top 10 and region need to be met simultaneously for a product to be returned.

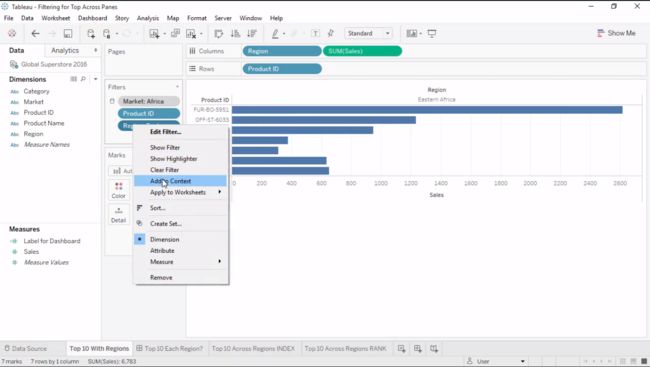
To filter for the top 10 products in a specific region, the setup is a little different. We need to let Tableau know that the Region needs to be considered before the Top 10 is calculated.
We could put the Region as a context filter, like we currently have for Market, but that isn’t very easily changed if we want to look at Northern Africa, then Western, etc.
Top 10 Across Dimensions Using INDEX
Alternatively, we can use the INDEX calculation to assign each product an index value per region, and then we can filter on this value.
Right click in the data pane and select Create Calculated Field. We’ll name this “Index”. In the formula area, type “INDEX()”. Click ok.

Find the new field, Index, here in the data pane. It’s currently a continuous measure. We’ll right click and select “convert to discrete”. This step is vital, because we need the index values to function as labels. Bring the Index field between Region and Product ID.
Now we need to tell Tableau how to calculate the Index—in other words, how we want the index to be assigned. Right click on the Index pill and select “Edit Table Calculation”. We’ll click Specific Dimensions, giving us complete control. We’ll leave Region and Product ID checked, keeping them as addressing fields because we want both to be considered when computing the index. We’ll set the “at the level” to Product ID, because we want the index values to be assigned per Product ID. And we’ll set “Restarting Every” to Region because we want to recalculate the index assignments independently per region. Finally, we need to set the sort. We’ll change it to Custom, and make it a Descending Sum of Sales.
Now that we have our indexes properly assigned, we can filter. We edited the table calculation on this pill specifically, so we have to bring a copy of this pill to the filter shelf. We can do so by holding down the control key while we click and drag, and we’ll select just 1-10. Now we have the top ten highest selling products individually per region.
Top 10 Across Dimensions Using Rank
Similarly, we could do the same process using the table calculation Rank. Right click in the data pane and select Create Calculated field.
We’ll use the RANK function, and have it rank on SUM(Sales), nd we can specify we want it to be descending. RANK(SUM(Sales), ‘desc’). We can see that what we’re ranking on is very similar to how we sorted our index values.
Like with INDEX, we want to convert this to discrete. And bring it between Region and Product. Previously, we said restarting every region. Here, we’ll right click and set the Compute Using to Pane down. This essentially does the same thing. We’ll again bring this pill to filter, select none, and choose 1-10. And we see this is an alternative way to again get the top 10 sales per region.