边距参数
Reference:
https://www.r-bloggers.com/setting-graph-margins-in-r-using-the-par-function-and-lots-of-cow-milk/
https://stackoverflow.com/questions/12415206/par-options-pin-and-oma-in-r
边距相关参数有两个mai(mar)和omi(oma),分别表示内边界【包括轴标题和主标题】和外边界【与窗口边框之间空白区域】,如下图所示:

mex
mex is a character size expansion factor which is used to describe coordinates in the margins of plots. Note that this does not change the font size, rather specifies the size of font (as a multiple of csi) used to convert between mar and mai, and between oma and omi.
This starts as 1 when the device is opened, and is reset when the layout is changed (alongside resetting cex).
相当于每一段字符的行高,mar、oma都以mex作为距离单位,默认值为1,为0.2 inches。
mai
A numerical vector of the form c(bottom, left, top, right) which gives the margin size specified in inches.
表示绘图区域周围的内边界宽度,其单位为英寸【1英寸=2.54厘米】,默认设置为
par("mai")
## [1] 1.02 0.82 0.82 0.42
mar
A numerical vector of the form c(bottom, left, top, right) which gives the number of lines of margin to be specified on the four sides of the plot. The default is c(5, 4, 4, 2) + 0.1.
除单位为number of lines of text【即文字的行高,mex】外,其余与mai相同,因此默认行高(mex)为0.2 inches:
par("mai")/par("mar")
## [1] 0.2 0.2 0.2 0.2
可以由以下代码进行验证mar的默认值
plot(1:10, ann=FALSE, type="n", xaxt="n", yaxt="n")
# mtext 默认为outer=FALSE即在内边界注释文本,line参数表示与图像区域的距离(行高)
for(j in 1:4) for(i in 0:10) mtext(as.character(i), side=j, line=i, outer=FALSE)

par("mar")
## [1] 5.1 4.1 4.1 2.1
内边界的应用
当出现轴标题与轴标注发生重叠时,可以手动设置mar来解决
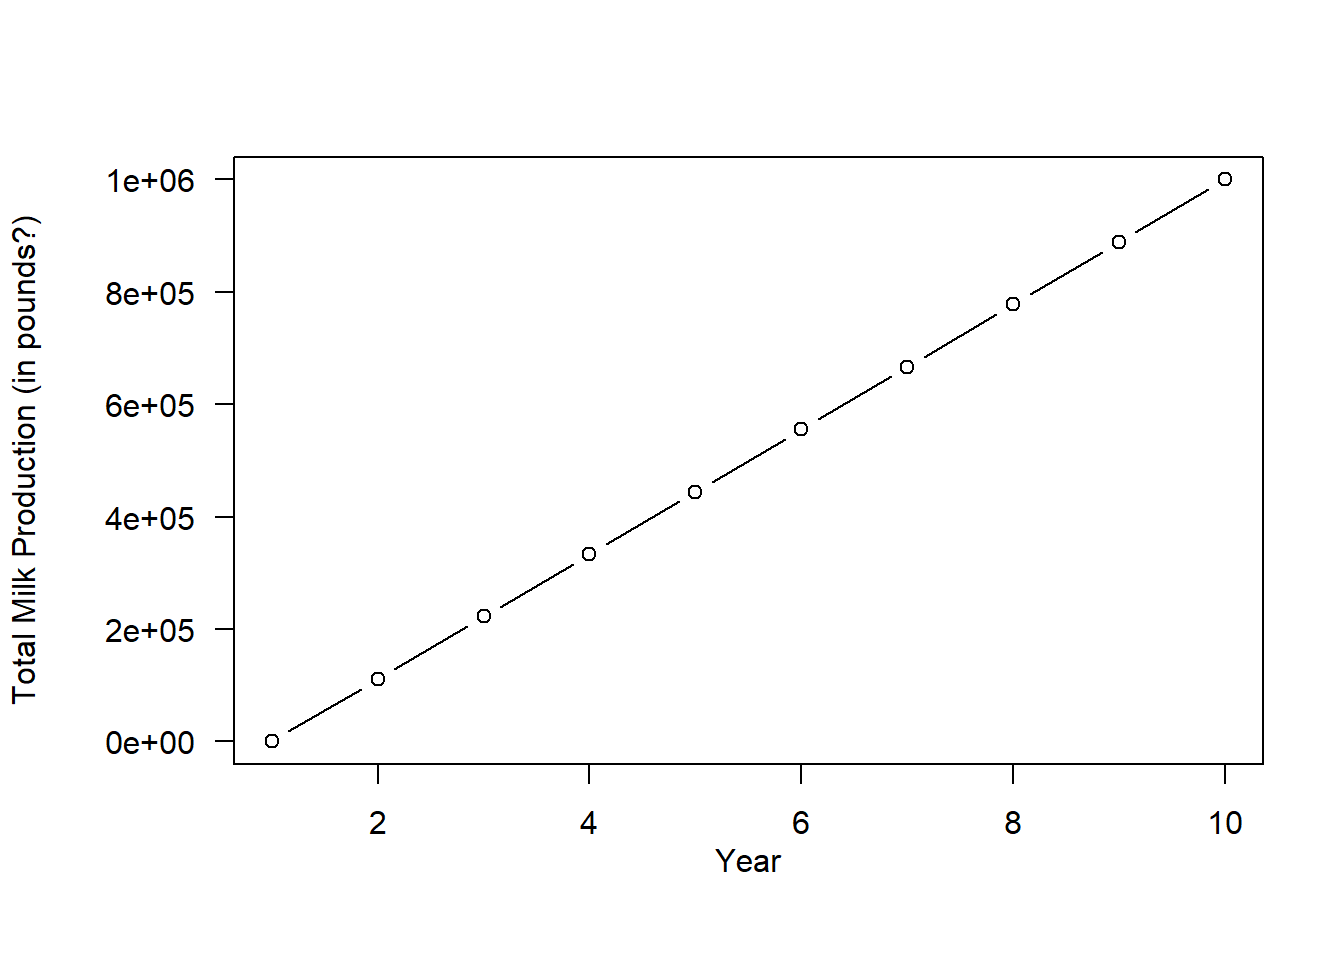
x <- 1:10
y <- seq(0.01, 100, length=10)*10000
plot(y~x, las=1, type="b", xlab="Year",  ylab="Total Milk Production (in pounds?)")

解决方案,使用mgp=c(5,1,0)把轴标题设置距离图形区域5,轴标签设置为1,轴本身为0,单位为行高【默认mgp=c(3, 1, 0)】
par(mar=c(5,6,4,2)+0.1,mgp=c(5,1,0))
x <- 1:10
y <- seq(0.01, 100, length=10)*10000
plot(y~x, las=1, type="b", xlab="Year",  ylab="Total Milk Production (in pounds?)")

此时细心的你可能发现了,x轴的标题不见了,因为mgp的设置是针对所有的轴的,不仅仅是改变y轴,而x轴的默认内边界为5个行高,正好把x轴标题挡在了外面。
我们可能会想到把mpg改为c(4,1,0),但是这样的话,x轴的标题距离x轴标签太远了,图形不太协调,因此可以加上mtext("Year", side=1, line=2, adj=0.5)命令在x轴手动加上标题
par(mar=c(5,6,4,2)+0.1,mgp=c(5,1,0))
x <- 1:10
y <- seq(0.01, 100, length=10)*10000
plot(y~x, las=1, type="b", xlab="Year",  ylab="Total Milk Production (in pounds?)")
mtext("Year", side=1, line=2, adj=0.5)
omi
A vector of the form c(bottom, left, top, right) giving the size of the outer margins in inches.
表示绘图区域周围的外边界宽度outer margins in inches,其单位为英寸【1英寸=2.54厘米】,默认设置为
par("omi")
## [1] 0 0 0 0
oma
A vector of the form c(bottom, left, top, right) giving the size of the outer margins in lines of text.
除单位为number of lines of text【即文字的行高,mex】外,其余与omi相同,默认值为0
omd
A vector of the form c(x1, x2, y1, y2) giving the region inside outer margins in NDC (= normalized device coordinates), i.e., as a fraction (in [0, 1]) of the device region.
除单位为normalized device coordinates【NDC,即占设备长或宽的多少倍,值在0-1之间】外,其余与omi相同
外边界宽度的应用
如下代码中,mtext添加的大标题超出了内边界
par(mar=c(5,7,4,2)+0.1)
x <- 1:10
y <- seq(0.01, 100, length=10)*10000
plot(y~x, las=1, type="b", xlab="Year",  ylab="", main="Milk Production")
mtext("Total Milk Production (in pounds?)", side=2, line=5, adj=0.5)

mtext("Milk Plots",side=3,line=-1,cex=2,outer=TRUE)

解决方法,设置上缘外边界为2即可
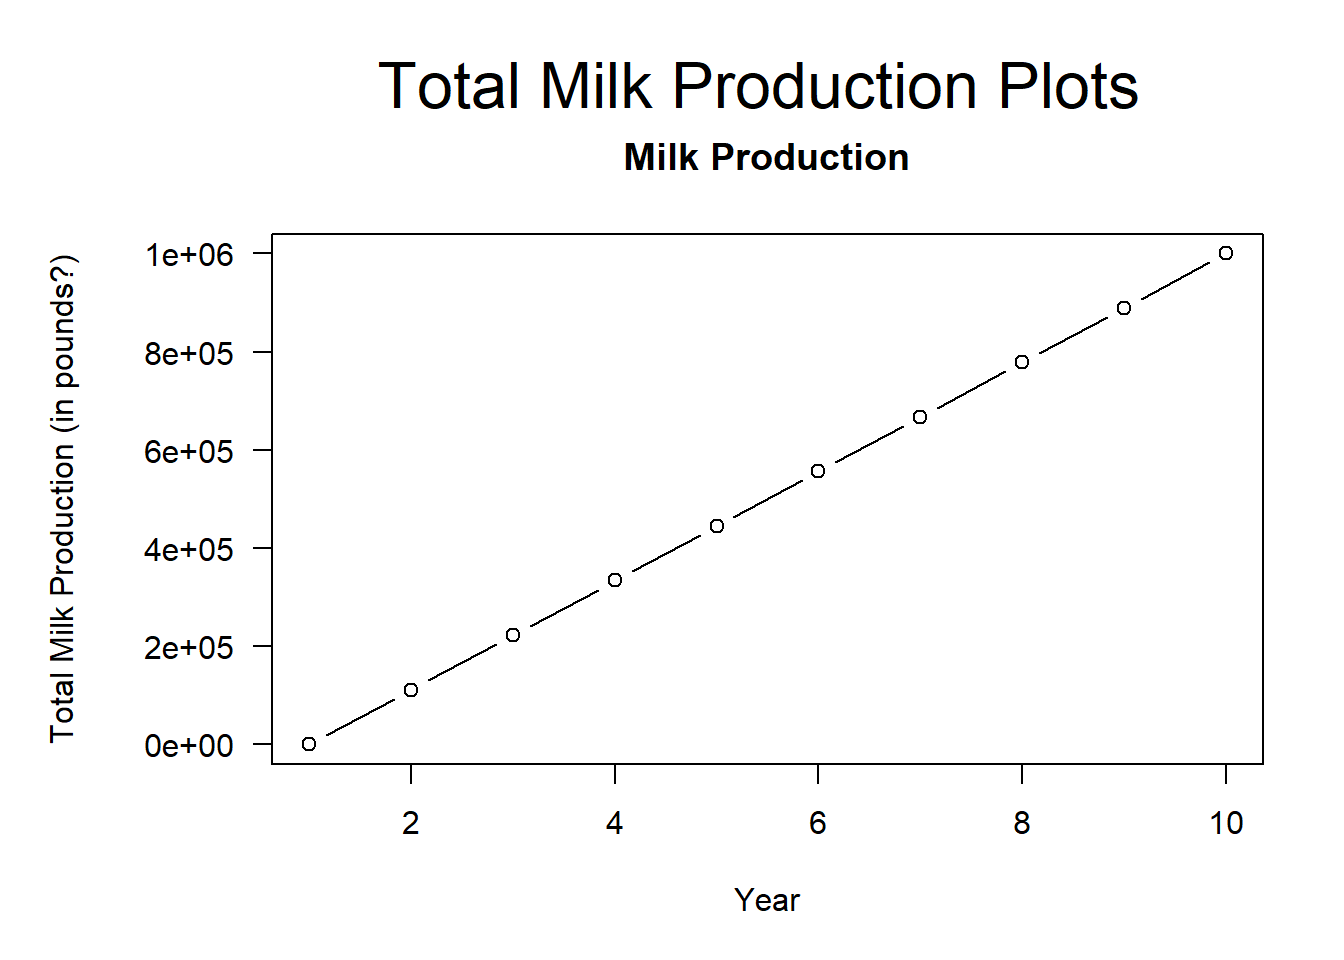
par(mar=c(5,7,4,2)+0.1, oma=c(0, 0, 2, 0))
x <- 1:10
y <- seq(0.01, 100, length=10)*10000
plot(y~x, las=1, type="b", xlab="Year",  ylab="", main="Milk Production")
mtext("Total Milk Production (in pounds?)", side=2, line=5, adj=0.5)

mtext("Total Milk Production Plots",side=3,line=-1,cex=2,outer=TRUE, adj=0.65)
最后
这图总结了一切,来自http://www.springer.com/us/book/9783319497501
