正弦曲线和LSTM
上篇文章我们了解了简单加法的机器学习,这次我们看看机器学习能不能搞定正弦曲线 :)
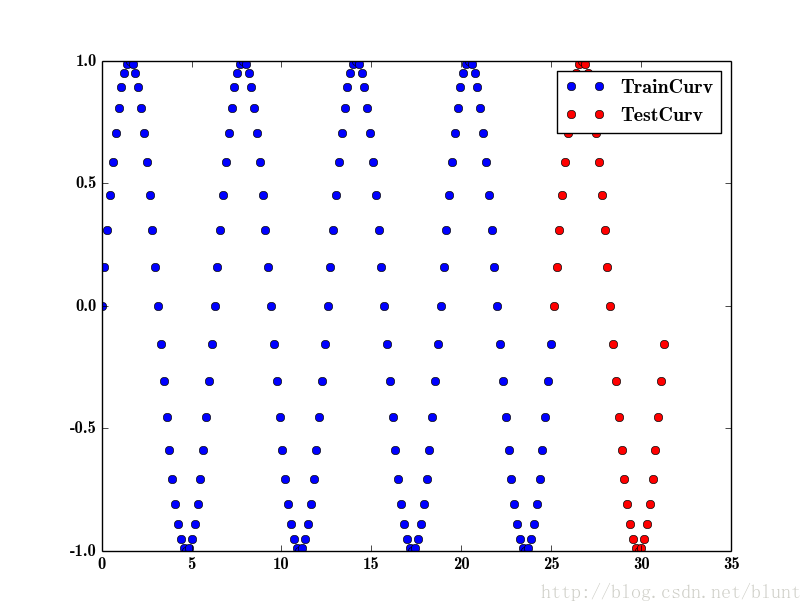
也就是给出蓝色的点(160个),看看能不能预测出红色点的位置(40个)
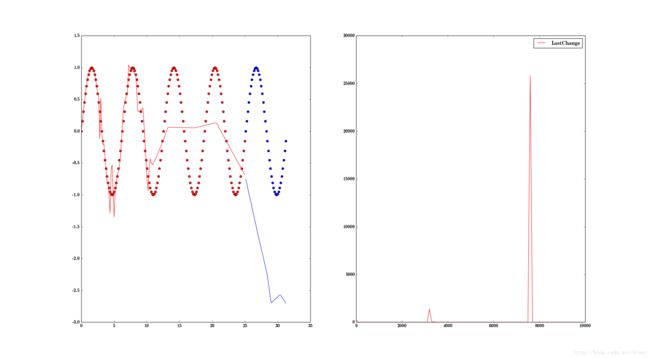
看到算出来的公式是一条直线,跟正弦曲线相差太远,而loss看起来的确是在减小,最小值是大概一,看起来还不错,但是实际上看看我们的loss函数的定义:
# Every single Sin Cycle has 40 points, has 5*0.8 Train cycles, and 5*0.2 Test Cycles
x_train,y_train,x_test,y_test = GeneData.GenData_sin(40,5,0.8)

X = tf.placeholder(tf.float32, [None,1],name="X")
Y = tf.placeholder(tf.float32,[None,1],name="Y")
with tf.name_scope('output') as scope:
    W = tf.Variable( tf.random_normal( [1, 1] ),name="weights")
    b = tf.Variable( tf.random_normal([1]) ,name="bias")
    model = tf.matmul(X, W) + b

loss = tf.reduce_mean( tf.pow(model - Y,2), name="loss")
train = tf.train.AdamOptimizer(learning_rate).minimize(loss)
是差值的平方,考虑到我们我们y值都是-1< y < 1的, 平方值肯定都比较小, 而loss为一其实是很大的了!
好吧,我们考虑用多层网络:
n_hidden_1 = 512
n_hidden_2 = 512
n_hidden_3 = 512
n_hidden_4 = 512
n_hidden_5 = 512
n_hidden_6 = 512
n_input = 1
n_output = 1

def multilayer_perceptron(x, weights, biases):
    # Hidden layer with RELU activation
    layer_1 = tf.add(tf.matmul(x, weights['h1']), biases['b1'])
    layer_1 = tf.nn.relu(layer_1)
    # Hidden layer with RELU activation
    layer_2 = tf.add(tf.matmul(layer_1, weights['h2']), biases['b2'])
    layer_2 = tf.nn.relu(layer_2)
    # Hidden layer with RELU activation
    layer_3 = tf.add(tf.matmul(layer_2, weights['h3']), biases['b3'])
    layer_3 = tf.nn.relu(layer_2)
    # Hidden layer with RELU activation
    layer_4 = tf.add(tf.matmul(layer_3, weights['h4']), biases['b4'])
    layer_4 = tf.nn.relu(layer_2)

    # Output layer with linear activation
    out_layer = tf.matmul(layer_4, weights['out']) + biases['out']
    return out_layer

def learn(x_train,y_train,x_test,y_test):
        # Store layers weight & bias
        weights = {
                'h1': tf.Variable(tf.random_normal([n_input, n_hidden_1])),
                'h2': tf.Variable(tf.random_normal([n_hidden_1, n_hidden_2])),
                'h3': tf.Variable(tf.random_normal([n_hidden_2, n_hidden_3])),
                'h4': tf.Variable(tf.random_normal([n_hidden_3, n_hidden_4])),
                'h5': tf.Variable(tf.random_normal([n_hidden_4, n_hidden_5])),
                'h6': tf.Variable(tf.random_normal([n_hidden_5, n_hidden_6])),
                'out': tf.Variable(tf.random_normal([n_hidden_6, n_output]))
        }
        biases = {
                'b1': tf.Variable(tf.random_normal([n_hidden_1])),
                'b2': tf.Variable(tf.random_normal([n_hidden_2])),
                'b3': tf.Variable(tf.random_normal([n_hidden_3])),
                'b4': tf.Variable(tf.random_normal([n_hidden_4])),
                'b5': tf.Variable(tf.random_normal([n_hidden_5])),
                'b6': tf.Variable(tf.random_normal([n_hidden_6])),
                'out': tf.Variable(tf.random_normal([n_output]))
        }

        # tf Graph input
        X = tf.placeholder("float", [None, n_input],name="X")
        Y = tf.placeholder("float", [None, n_output],name="Y")

        pred = multilayer_perceptron(X, weights, biases)
        loss = tf.reduce_mean( tf.pow(pred - Y,2),name="cost")
        train = tf.train.AdamOptimizer(learning_rate).minimize(loss)
看看效果吧, 先做1000次:

曲线出来了, 比之前的直线有进步, 但是效果还是不好,再试试10000次?

效果还是不太好, 我们可以看到在训练数据中,还算是靠谱的, 尤其是前几个周期,但是到了后来测试数据时,完全背离了。
这时候看来单纯增加训练轮数和网络层数可能也不解决问题了。
这时候我们需要考虑使用LSTM:
lstm的概念已经有很多文章讲了,我们就不多说了。只需要记住一点,LSTM是跟着时间轴走的,所以它的输入是时间,没有什么输入X。我们要做的就是把时间连续平均的Y值输入,然后让它预测后续某段时长的结果。
先看看实际结果吧:

其中蓝色线是输入数据,红色曲线是正确值,红色点则是预测值。为什么有三附图呢?仔细看横坐标,也就是时间轴,发现每个正弦周期分别是60,30,20, 而我们进行机器学习用的是周期为60的数据。可以看到,利用周期为60的数据对周期为30,20的正弦曲线的学习效果也不错啊!
这是为什么呢? 其实很简单, 因为作为LSTM学习的输入,我们输入的是Y值序列,而时间具体值我们根本没有提交给学习过程。因此,这三个学习的输入根本是一样的!
下面是具体代码:
learning_rate = 0.01
training_epochs = 5000
display_step = 50
batch_size = 20

n_input = 1 #num of parameter of sin(x)
NumTrainCycle = 2
NumTestCycle = 1
NumPerCycle = 60 # how many sampling point in each sin cycle(2PI)
n_step = NumTrainCycle * NumPerCycle # num of timesteps
n_test  = NumTestCycle  * NumPerCycle

n_hidden = n_step # hidden layer num of features

def RNN(x, weights, biases, n_input, n_step, n_hidden):
        # Prepare data shape to match `rnn` function requirements (batch_size, n_step, n_input) --> (batch_size, n_input)

        # Permuting batch_size and n_step
        x = tf.transpose(x, [1, 0, 2])
        # Reshaping to (n_step*batch_size, n_input)
        x = tf.reshape(x, [-1, n_input])
        # Split to get a list of 'n_step' tensors of shape (batch_size, n_input)
        x = tf.split(x, n_step, axis=0)

        # Define a lstm cell with tensorflow
        lstm_cell = rnn.BasicLSTMCell(n_hidden, forget_bias=1)

        # Get lstm cell output
        outputs, states = rnn.static_rnn(lstm_cell, x, dtype=tf.float32)

        # Linear activation, using rnn inner loop last output
        return tf.nn.bias_add(tf.matmul(outputs[-1], weights['out']), biases['out'])

def learn():

        # Store layers weight & bias
        weights = {'out': tf.Variable(tf.random_normal([n_hidden, n_test]))}
        biases = {'out': tf.Variable(tf.random_normal([n_test])) }

        # tf Graph input
        X = tf.placeholder("float", [None, n_step, n_input],name="X")

       Y = tf.placeholder("float", [None, n_test],name="Y")

        pred = RNN(X, weights, biases,n_input, n_step, n_hidden)
        #cost = tf.reduce_mean( tf.pow(pred - Y,2)/y_train.shape[0],name="cost")
        individual_losses = tf.reduce_sum(tf.squared_difference(pred, Y), reduction_indices=1)
        cost = tf.reduce_mean(individual_losses)
        optimizer = tf.train.AdamOptimizer(learning_rate=learning_rate).minimize(cost)

        # Initializing the variables
        init = tf.global_variables_initializer()

        # Launch the graph
        with tf.Session() as sess:
                sess.run(init)
                step = 0

                while step * batch_size < training_epochs:
                        step = step + 1
                        _,y_train,_t,y_test=GenData(Shift=None,NumCycle = NumTrainCycle,NumPredCycle=NumTestCycle,NumPerCycle=NumPerCycle,BatchSize=batch_size)
                        batch_x = y_train.reshape((batch_size, n_step, n_input))
                        batch_y = y_test.reshape((batch_size, n_test))

                        sess.run(optimizer, feed_dict={X: batch_x, Y: batch_y})
                        if step % display_step == 0:
                                c = sess.run(cost, feed_dict={X: batch_x, Y: batch_y})

                       if step % display_step == 0:
                                c = sess.run(cost, feed_dict={X: batch_x, Y: batch_y})
                                print("Iter " + str(step*batch_size) + ", Minibatch Loss= " + "{:.6f}".format(c))

                n_freq = 3
                for i in range(1,n_freq+1):
                        plt.subplot(n_freq, 1, i)
                        t, y, next_t, expected_y = GenData(Freq=i, Shift=1,NumCycle = NumTrainCycle,NumPredCycle=NumTestCycle,NumPerCycle=NumPerCycle )
                        t = t.squeeze()
                        y = y.squeeze()
                        next_t = next_t.squeeze()
                        expected_y = expected_y.squeeze()

                        #Input Train Data
                        plt.plot(t, y, 'b',label='Input')

                        #Expected pred data
                        plt.plot(next_t, expected_y, 'r',label='Expected')

                        test_input = y.reshape((1, n_step, n_input))
                        prediction = sess.run(pred, feed_dict={X: test_input})

                        prediction = prediction.squeeze()
                        plt.plot(next_t, prediction, 'ro',label='Pred')
                        plt.ylim([-1, 1])

                        plt.xlabel('time [t]')
                        plt.ylabel('signal')

                plt.legend()
                plt.show()
