《Hands-On Machine Learning with Scikit-Learn & TensorFlow》读书笔记 第二章 机器学习项目
第二章 端到端机器学习项目
End-to-End Machine Learning Project
流水线 Pipeline
一系列的数据处理组件被称为数据流水线。流水线在机器学习系统中很常见,因为有许多数据要处理和转换。
组件通常是异步运行的。每个组件吸纳进大量数据,进行处理,然后将数据传输到另一个数据容器中,而后流水线中的另一个组件收入这个数据,然后输出,这个过程依次进行下去。每个组件都是独立的:组件间的接口只是数据容器。这样可以让系统更便于理解(记住数据流的图),不同的项目组可以关注于不同的组件。进而,如果一个组件失效了,下游的组件使用失效组件最后生产的数据,通常可以正常运行(一段时间)。这样就使整个架构相当健壮。
另一方面,如果没有监控,失效的组件会在不被注意的情况下运行一段时间。数据会受到污染,整个系统的性能就会下降。

选择性能指标
回归问题的典型指标是均方根误差(RMSE)。均方根误差测量的是系统预测误差的标准差。例如,RMSE 等于 50000,意味着,68% 的系统预测值位于实际值的 50000 美元以内,95% 的预测值位于实际值的 100000 美元以内(一个特征通常都符合高斯分布,即满足 “68-95-99.7”规则:大约68%的值落在1σ内,95% 的值落在2σ内,99.7%的值落在3σ内,这里的σ等于50000)。公式 2-1 展示了计算 RMSE 的方法。
公式 2-1 均方根误差(RMSE)

虽然大多数时候 RMSE 是回归任务可靠的性能指标,在有些情况下,你可能需要另外的函数。例如,假设存在许多异常的街区。此时,你可能需要使用平均绝对误差(Mean Absolute Error,也称作平均绝对偏差)
公式2-2 平均绝对误差
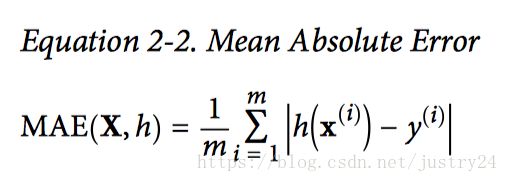
RMSE 和 MAE 都是测量预测值和目标值两个向量距离的方法。RMSE 比 MAE 对异常值更敏感。但是当异常值是指数分布的(类似正态曲线),RMSE 就会表现很好。
实例:房价预测
下载数据
import os
import tarfile
from six.moves import urllib

DOWNLOAD_ROOT = "https://raw.githubusercontent.com/ageron/handson-ml/master/"
HOUSING_PATH = "datasets/housing"
HOUSING_URL = DOWNLOAD_ROOT + HOUSING_PATH + "/housing.tgz"

def fetch_housing_data(housing_url=HOUSING_URL, housing_path=HOUSING_PATH):
    if not os.path.isdir(housing_path):
        os.makedirs(housing_path)
    tgz_path = os.path.join(housing_path, "housing.tgz")
    urllib.request.urlretrieve(housing_url, tgz_path)
    housing_tgz = tarfile.open(tgz_path)
    housing_tgz.extractall(path=housing_path)
    housing_tgz.close()
简单查看数据
import pandas as pd

def load_housing_data(housing_path=HOUSING_PATH):
    csv_path = os.path.join(housing_path, "housing.csv")
    return pd.read_csv(csv_path)
查看前几行数据
housing = load_housing_data()
housing.head()housing.info()housing.describe()简单可视化
%matplotlib inline
import matplotlib.pyplot as plt
housing.hist(bins=50, figsize=(20,15))
plt.show() #1
切分训练集和测试集
import numpy as np

def split_train_test(data, test_ratio):
    shuffled_indices = np.random.permutation(len(data))
    test_set_size = int(len(data) * test_ratio)
    test_indices = shuffled_indices[:test_set_size]
    train_indices = shuffled_indices[test_set_size:]
return data.iloc[train_indices], data.iloc[test_indices]train_set, test_set = split_train_test(housing, 0.2)
print(len(train_set), "train +", len(test_set), "test")16512 train + 4128 test
这个方法可行,但是并不完美:如果再次运行程序,就会产生一个不同的测试集!多次运行之后,你(或你的机器学习算法)就会得到整个数据集,这是需要避免的。
解决的办法之一是保存第一次运行得到的测试集,并在随后的过程加载。另一种方法是在调用np.random.permutation()之前,设置随机数生成器的种子(比如np.random.seed(42)),以产生总是相同的洗牌指数(shuffled indices)。
但是如果数据集更新,这两个方法都会失效。一个通常的解决办法是使用每个实例的ID来判定这个实例是否应该放入测试集(假设每个实例都有唯一并且不变的ID)。例如,你可以计算出每个实例ID的哈希值,只保留其最后一个字节,如果该值小于等于 51(约为 256 的 20%),就将其放入测试集。这样可以保证在多次运行中,测试集保持不变,即使更新了数据集。新的测试集会包含新实例中的 20%,但不会有之前位于训练集的实例。
使用hush表划分:
import hashlib

def test_set_check(identifier, test_ratio, hash):
    return hash(np.int64(identifier)).digest()[-1] < 256 * test_ratio

def split_train_test_by_id(data, test_ratio, id_column,hash=hashlib.md5):
    ids = data[id_column]
    in_test_set = ids.apply(lambda id_: test_set_check(id_, test_ratio, hash))
    return data.loc[~in_test_set], data.loc[in_test_set]
housing_with_id = housing.reset_index() # 增加一个索引列
train_set, test_set = split_train_test_by_id(housing_with_id, 0.2, "index")
print(len(train_set), "train +", len(test_set), "test")如果不添加新的列序号作为id列,也可以选择最稳定的属性作为列 (在本例中可以使用经度或者维度)
housing_with_id["id"] = housing["longitude"] * 1000 + housing["latitude"]
train_set, test_set = split_train_test_by_id(housing_with_id, 0.2, "id")
使用scikit-learn 自带的划分函数
from sklearn.model_selection import train_test_split

train_set, test_set = train_test_split(housing, test_size=0.2, random_state=42)
目前为止,我们采用的都是纯随机的取样方法。当你的数据集很大时(尤其是和属性数相比),这通常可行;但如果数据集不大,就会有采样偏差的风险。当一个调查公司想要对 1000 个人进行调查,它们不是在电话亭里随机选 1000 个人出来。调查公司要保证这 1000 个人对人群整体有代表性。例如,美国人口的 51.3% 是女性,48.7% 是男性。所以在美国,严谨的调查需要保证样本也是这个比例:513 名女性,487 名男性。这称作分层采样(stratified sampling):将人群分成均匀的子分组,称为分层,从每个分层去取合适数量的实例,以保证测试集对总人数有代表性。如果调查公司采用纯随机采样,会有 12% 的概率导致采样偏差:女性人数少于 49%,或多于 54%。不管发生那种情况,调查结果都会严重偏差。
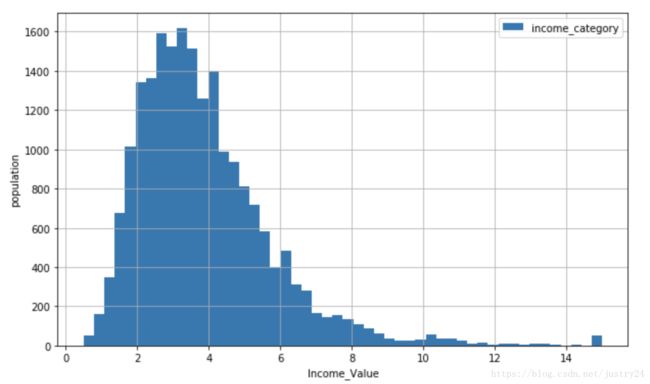
查看收入分布矩形图
plt.figure(figsize=(10,6))
plt.hist(housing["median_income"],bins=50,label = ["income_category"])
plt.grid(True) # 网格
plt.legend(loc=0) #最佳位置显示图例
plt.xlabel('Income_Value')
plt.ylabel('population')
plt.show()
大部分收入为 2-5(万美元) , 如果按照1为单位分割,分出的层数过多,因此,可将高于5的合并为1类。
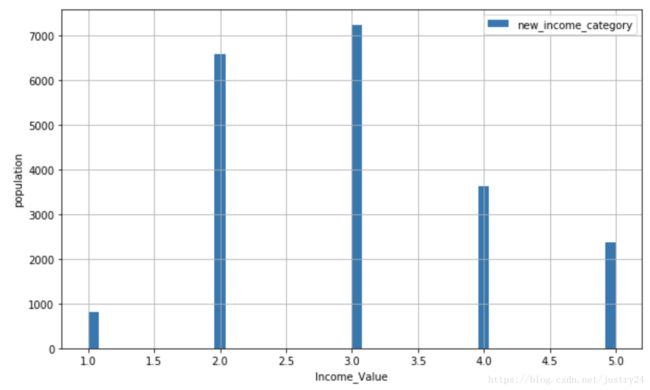
使用ceil(具有离散类别)进行四舍五入, 处以 1.5 以减小类别总数
housing["income_cat"] = np.ceil(housing["median_income"] / 1.5)
housing["income_cat"].where(housing["income_cat"] < 5, 5.0, inplace=True)plt.figure(figsize=(10,6))
plt.hist(housing["income_cat"],bins=50,label = ["new_income_category"])
plt.grid(True) # 网格
plt.legend(loc=0) #最佳位置显示图例
plt.xlabel('Income_Value')
plt.ylabel('population')
plt.show()现在,就可以根据收入分类,进行分层采样。
除此之外,也可以使用 Scikit-Learn 的StratifiedShuffleSplit类:
from sklearn.model_selection import StratifiedShuffleSplit

split = StratifiedShuffleSplit(n_splits=1, test_size=0.2, random_state=42)
for train_index, test_index in split.split(housing, housing["income_cat"]):
    strat_train_set = housing.loc[train_index]
    strat_test_set = housing.loc[test_index]
对比了总数据集、分层采样的测试集、纯随机采样测试集的收入分类比例。可以看到,分层采样测试集的收入分类比例与总数据集几乎相同,而随机采样数据集偏差严重。

现在,你需要删除income_cat属性,使数据回到初始状态:
for set in (strat_train_set, strat_test_set):
    set.drop(["income_cat"], axis=1, inplace=True)
地理数据可视化
首先,保证你将测试集放在了一旁,只是研究训练集。另外,如果训练集非常大,你可能需要再采样一个探索集,保证操作方便快速。在我们的案例中,数据集很小,所以可以在全集上直接工作。创建一个副本,以免损伤训练集:
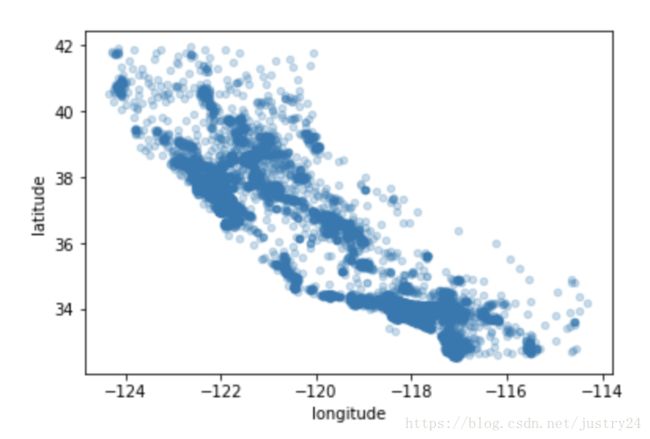
将alpha设为 0.1,可以更容易看出数据点的密度
housing.plot(kind="scatter", x="longitude", y="latitude", alpha=0.25)使用颜色表示价格,加入地图
import matplotlib.image as mpimg
california_img=mpimg.imread('california.png')
ax = housing.plot(kind="scatter", x="longitude", y="latitude", figsize=(10,7),
                       s=housing['population']/100, label="Population",
                       c="median_house_value", cmap=plt.get_cmap("jet"),
                       colorbar=False, alpha=0.4,
                      )
plt.imshow(california_img, extent=[-124.55, -113.80, 32.45, 42.05], alpha=0.5)
plt.ylabel("Latitude", fontsize=14)
plt.xlabel("Longitude", fontsize=14)

prices = housing["median_house_value"]
tick_values = np.linspace(prices.min(), prices.max(), 11)
cbar = plt.colorbar()
cbar.ax.set_yticklabels(["$%dk"%(round(v/1000)) for v in tick_values], fontsize=14)
cbar.set_label('Median House Value', fontsize=16)

plt.legend(fontsize=16)
plt.show()
查看相关性
相关系数的范围是 -1 到 1。当接近 1 时,意味强正相关;例如,当收入中位数增加时,房价中位数也会增加。当相关系数接近 -1 时,意味强负相关;你可以看到,纬度和房价中位数有轻微的负相关性(即,越往北,房价越可能降低)。最后,相关系数接近 0,意味没有线性相关性。图 2-14 展示了相关系数在横轴和纵轴之间的不同图形。
corr_matrix = housing.corr()
corr_matrix["median_house_value"].sort_values(ascending=False)
median_house_value 1.000000
median_income 0.687160
total_rooms 0.135097
housing_median_age 0.114110
households 0.064506
total_bedrooms 0.047689
population -0.026920
longitude -0.047432
latitude -0.142724
Name: median_house_value, dtype: float64
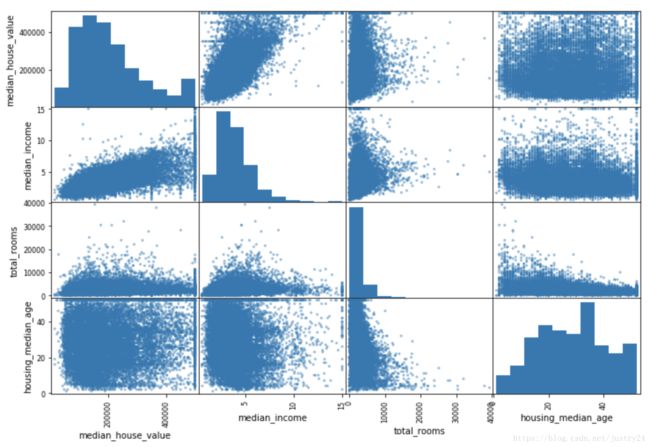
查看 4个属性 两两相关系分析图
from pandas.plotting import scatter_matrix

attributes = ["median_house_value", "median_income", "total_rooms", "housing_median_age"]
scatter_matrix(housing[attributes], figsize=(12, 8))
查看 房价 和 收入 的关系图
housing.plot(figsize=(8,6), kind="scatter", x="median_income", y="median_house_value", alpha=0.25)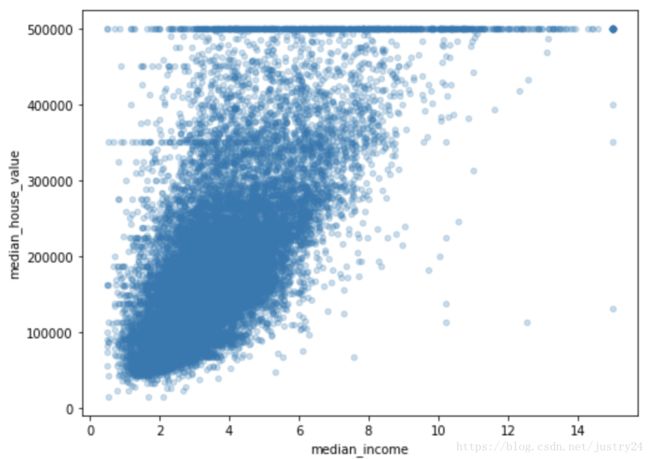
这张图说明了几点。首先,相关性非常高;可以清晰地看到向上的趋势,并且数据点不是非常分散。第二,我们之前看到的最高价,清晰地呈现为一条位于 500000 美元的水平线。这张图也呈现了一些不是那么明显的直线:一条位于 450000 美元的直线,一条位于 350000 美元的直线,一条在 280000 美元的线,和一些更靠下的线。应该去除对应的街区,以防止算法重复这些巧合。
属性组合试验
housing["rooms_per_household"] = housing["total_rooms"]/housing["households"]
housing["bedrooms_per_room"] = housing["total_bedrooms"]/housing["total_rooms"]
housing["population_per_household"]=housing["population"]/housing["households"]
corr_matrix = housing.corr()
corr_matrix["median_house_value"].sort_values(ascending=False)
median_house_value 1.000000
median_income 0.687160
rooms_per_household 0.146285
total_rooms 0.135097
housing_median_age 0.114110
households 0.064506
total_bedrooms 0.047689
population_per_household -0.021985
population -0.026920
longitude -0.047432
latitude -0.142724
bedrooms_per_room -0.259984
Name: median_house_value, dtype: float64
为机器学习算法准备数据
现在来为机器学习算法准备数据。不要手工来做,你需要写一些函数,理由如下:
函数可以让你在任何数据集上(比如,你下一次获取的是一个新的数据集)方便地进行重复数据转换。
你能慢慢建立一个转换函数库,可以在未来的项目中复用。
在将数据传给算法之前,你可以在实时系统中使用这些函数。
这可以让你方便地尝试多种数据转换,查看哪些转换方法结合起来效果最好。
数据清洗
大多机器学习算法不能处理缺失的特征,因此先创建一些函数来处理特征缺失的问题。前面,你应该注意到了属性total_bedrooms有一些缺失值。有三个解决选项:
去掉对应的街区;
去掉整个属性;
进行赋值(0、平均值、中位数等等)。
用DataFrame的dropna(),drop(),和fillna()方法,可以方便地实现:
housing.dropna(subset=["total_bedrooms"])    # 选项1
housing.drop("total_bedrooms", axis=1)       # 选项2
median = housing["total_bedrooms"].median()
housing["total_bedrooms"].fillna(median)     # 选项3
Scikit-Learn 提供了一个方便的类来处理缺失值:Imputer。下面是其使用方法:首先,需要创建一个Imputer实例,指定用某属性的中位数来替换该属性所有的缺失值:
from sklearn.preprocessing import Imputer

imputer = Imputer(strategy="median")
因为只有数值属性才能算出中位数,我们需要创建一份不包括文本属性ocean_proximity的数据副本:
housing_num = housing.drop("ocean_proximity", axis=1)现在,就可以用fit()方法将imputer实例拟合到训练数据:
imputer.fit(housing_num)imputer计算出了每个属性的中位数,并将结果保存在了实例变量statistics_中。虽然此时只有属性total_bedrooms存在缺失值,但我们不能确定在以后的新的数据中会不会有其他属性也存在缺失值,所以安全的做法是将imputer应用到每个数值:
>>> imputer.statistics_
array([ -118.51 , 34.26 , 29. , 2119. , 433. , 1164. , 408. , 3.5414])
>>> housing_num.median().values
array([ -118.51 , 34.26 , 29. , 2119. , 433. , 1164. , 408. , 3.5414])
现在,你就可以使用这个“训练过的”imputer来对训练集进行转换,将缺失值替换为中位数:
X = imputer.transform(housing_num)结果是一个包含转换后特征的普通的 Numpy 数组。如果你想将其放回到 PandasDataFrame中,也很简单:
housing_tr = pd.DataFrame(X, columns=housing_num.columns)scikit-Learn 设计
Scikit-Learn 设计的 API 设计的非常好。它的主要设计原则是:
- 一致性:所有对象的接口一致且简单:
- 估计器(estimator)。任何可以基于数据集对一些参数进行估计的对象都被称为估计器(比如,imputer就是个估计器)。估计本身是通过fit()方法,只需要一个数据集作为参数(对于监督学习算法,需要两个数据集;第二个数据集包含标签)。任何其它用来指导估计过程的参数都被当做超参数(比如imputer的strategy),并且超参数要被设置成实例变量(通常通过构造器参数设置)。
- 转换器(transformer)。一些估计器(比如imputer)也可以转换数据集,这些估计器被称为转换器。API也是相当简单:转换是通过transform()方法,被转换的数据集作为参数。返回的是经过转换的数据集。转换过程依赖学习到的参数,比如imputer的例子。所有的转换都有一个便捷的方法fit_transform(),等同于调用fit()再transform()(但有时fit_transform()经过优化,运行的更快)。
- 预测器(predictor)。最后,一些估计器可以根据给出的数据集做预测,这些估计器称为预测器。例如,上一章的LinearRegression模型就是一个预测器:它根据一个国家的人均 GDP 预测生活满意度。预测器有一个predict()方法,可以用新实例的数据集做出相应的预测。预测器还有一个score()方法,可以根据测试集(和相应的标签,如果是监督学习算法的话)对预测进行衡器。
- 可检验。所有估计器的超参数都可以通过实例的public变量直接访问(比如,imputer.strategy),并且所有估计器学习到的参数也可以通过在实例变量名后加下划线来访问(比如,imputer.statistics_)。
- 类不可扩散。数据集被表示成 NumPy 数组或 SciPy 稀疏矩阵,而不是自制的类。超参数只是普通的 Python 字符串或数字。
- 可组合。尽可能使用现存的模块。例如,用任意的转换器序列加上一个估计器,就可以做成一个流水线,后面会看到例子。
- 合理的默认值。Scikit-Learn 给大多数参数提供了合理的默认值,很容易就能创建一个系统。
处理文本和类别属性
前面,我们丢弃了类别属性ocean_proximity,因为它是一个文本属性,不能计算出中位数。大多数机器学习算法跟喜欢和数字打交道,所以让我们把这些文本标签转换为数字。
Scikit-Learn 为这个任务提供了一个转换器LabelEncoder:
>>> from sklearn.preprocessing import LabelEncoder
>>> encoder = LabelEncoder()
>>> housing_cat = housing["ocean_proximity"]
>>> housing_cat_encoded = encoder.fit_transform(housing_cat)
>>> housing_cat_encoded
array([1, 1, 4, ..., 1, 0, 3])
one-hot 编码
from sklearn.preprocessing import OneHotEncoder

encoder = OneHotEncoder()
housing_cat_1hot = encoder.fit_transform(housing_cat_encoded.reshape(-1,1))
housing_cat_1hot
housing_cat_1hot.toarray()
array([[ 1.,  0.,  0.,  0.,  0.],
       [ 1.,  0.,  0.,  0.,  0.],
       [ 0.,  0.,  0.,  0.,  1.],
       ...,
       [ 0.,  1.,  0.,  0.,  0.],
       [ 1.,  0.,  0.,  0.,  0.],
       [ 0.,  0.,  0.,  1.,  0.]])
一步到位转化为 one-hot 编码
from sklearn.preprocessing import LabelBinarizer

encoder = LabelBinarizer()
housing_cat_1hot = encoder.fit_transform(housing_cat)
housing_cat_1hot
查看每个属性的相对重要性
feature_importances = grid_search.best_estimator_.feature_importances_
feature_importances

>>>sorted(zip(feature_importances, attributes), reverse=True)
[(0.38116788729269108, 'median_income'),
 (0.14834104293920955, 'INLAND'),
 (0.11522974587061094, 'pop_per_hhold'),
 (0.07343990809452787, 'longitude'),
 (0.065197302655228426, 'latitude'),
 (0.053097358451368204, 'bedrooms_per_room'),
 (0.05173162233328224, 'rooms_per_hhold'),
 (0.041791170681639768, 'housing_median_age'),
 (0.014975437359951322, 'total_rooms'),
 (0.014957346363156808, 'households'),
 (0.014775334991775002, 'population'),
 (0.014774164350754437, 'total_bedrooms'),
 (0.0059781271620092486, '<1H OCEAN'),
 (0.0026599386262544976, 'NEAR OCEAN'),
 (0.0018398236635861292, 'NEAR BAY'),
 (4.3789163954449664e-05, 'ISLAND')]
特征缩放
数据要做的最重要的转换之一是特征缩放。除了个别情况,当输入的数值属性量度不同时,机器学习算法的性能都不会好。这个规律也适用于房产数据:总房间数分布范围是 6 到 39320,而收入中位数只分布在 0 到 15。注意通常情况下我们不需要对目标值进行缩放。
有两种常见的方法可以让所有的属性有相同的量度:线性函数归一化(Min-Max scaling)和标准化(standardization)。
线性函数归一化(许多人称其为归一化(normalization))很简单:值被转变、重新缩放,直到范围变成 0 到 1。我们通过减去最小值,然后再除以最大值与最小值的差值,来进行归一化。Scikit-Learn 提供了一个转换器MinMaxScaler来实现这个功能。它有一个超参数feature_range,可以让你改变范围,如果不希望范围是 0 到 1。
标准化就很不同:首先减去平均值(所以标准化值的平均值总是 0),然后除以方差,使得到的分布具有单位方差。与归一化不同,标准化不会限定值到某个特定的范围,这对某些算法可能构成问题(比如,神经网络常需要输入值得范围是 0 到 1)。但是,标准化受到异常值的影响很小。例如,假设一个街区的收入中位数由于某种错误变成了100,归一化会将其它范围是 0 到 15 的值变为 0-0.15,但是标准化不会受什么影响。Scikit-Learn 提供了一个转换器StandardScaler来进行标准化。
警告:与所有的转换一样,缩放器只能向训练集拟合,而不是向完整的数据集(包括测试集)。只有这样,你才能用缩放器转换训练集和测试集(和新数据)。
流水线Pipeline
你已经看到,存在许多数据转换步骤,需要按一定的顺序执行。幸运的是,Scikit-Learn 提供了类Pipeline,来进行这一系列的转换。下面是一个数值属性的小流水线:
from sklearn.pipeline import Pipeline
from sklearn.preprocessing import StandardScaler

num_pipeline = Pipeline([
        ('imputer', Imputer(strategy="median")),
        ('attribs_adder', CombinedAttributesAdder()),
        ('std_scaler', StandardScaler()),
        ])

housing_num_tr = num_pipeline.fit_transform(housing_num)
Pipeline构造器需要一个定义步骤顺序的名字/估计器对的列表。除了最后一个估计器,其余都要是转换器(即,它们都要有fit_transform()方法)。名字可以随意起。
当你调用流水线的fit()方法,就会对所有转换器顺序调用fit_transform()方法,将每次调用的输出作为参数传递给下一个调用,一直到最后一个估计器,它只执行fit()方法。
流水线暴露相同的方法作为最终的估计器。在这个例子中,最后的估计器是一个StandardScaler,它是一个转换器,因此这个流水线有一个transform()方法,可以顺序对数据做所有转换(它还有一个fit_transform方法可以使用,就不必先调用fit()再进行transform())。
你现在就有了一个对数值的流水线,你还需要对分类值应用LabelBinarizer:如何将这些转换写成一个流水线呢?Scikit-Learn 提供了一个类FeatureUnion实现这个功能。你给它一列转换器(可以是所有的转换器),当调用它的transform()方法,每个转换器的transform()会被并行执行,等待输出,然后将输出合并起来,并返回结果(当然,调用它的fit()方法就会调用每个转换器的fit())。一个完整的处理数值和类别属性的流水线如下所示:
from sklearn.pipeline import FeatureUnion

num_attribs = list(housing_num)
cat_attribs = ["ocean_proximity"]

num_pipeline = Pipeline([
        ('selector', DataFrameSelector(num_attribs)),
        ('imputer', Imputer(strategy="median")),
        ('attribs_adder', CombinedAttributesAdder()),
        ('std_scaler', StandardScaler()),
    ])

cat_pipeline = Pipeline([
        ('selector', DataFrameSelector(cat_attribs)),
        ('label_binarizer', LabelBinarizer()),
    ])

full_pipeline = FeatureUnion(transformer_list=[
        ("num_pipeline", num_pipeline),
        ("cat_pipeline", cat_pipeline),
    ])

housing_prepared = full_pipeline.fit_transform(housing)

>>>housing_prepared

array([[-1.15604281,  0.77194962,  0.74333089, ...,  0.        ,
         0.        ,  0.        ],
       [-1.17602483,  0.6596948 , -1.1653172 , ...,  0.        ,
         0.        ,  0.        ],
       [ 1.18684903, -1.34218285,  0.18664186, ...,  0.        ,
         0.        ,  1.        ],
       ...,
       [ 1.58648943, -0.72478134, -1.56295222, ...,  0.        ,
         0.        ,  0.        ],
       [ 0.78221312, -0.85106801,  0.18664186, ...,  0.        ,
         0.        ,  0.        ],
       [-1.43579109,  0.99645926,  1.85670895, ...,  0.        ,
         1.        ,  0.        ]])
每个子流水线都以一个选择转换器开始:通过选择对应的属性(数值或分类)、丢弃其它的,来转换数据,并将输出DataFrame转变成一个 NumPy 数组。Scikit-Learn 没有工具来处理 PandasDataFrame,因此我们需要写一个简单的自定义转换器来做这项工作:
from sklearn.base import BaseEstimator, TransformerMixin

class DataFrameSelector(BaseEstimator, TransformerMixin):
    def __init__(self, attribute_names):
        self.attribute_names = attribute_names
    def fit(self, X, y=None):
        return self
    def transform(self, X):
        return X[self.attribute_names].values
选择并训练模型
训练一个线性回归模型:
from sklearn.linear_model import LinearRegression

lin_reg = LinearRegression()
lin_reg.fit(housing_prepared, housing_labels)
用全部训练集来计算下这个回归模型的 RMSE:
from sklearn.metrics import mean_squared_error

housing_predictions = lin_reg.predict(housing_prepared)
lin_mse = mean_squared_error(housing_labels, housing_predictions)
lin_rmse = np.sqrt(lin_mse)

>>>lin_rmse

68628.198198489219
使用决策树
from sklearn.tree import DecisionTreeRegressor

tree_reg = DecisionTreeRegressor()
tree_reg.fit(housing_prepared, housing_labels)
housing_predictions = tree_reg.predict(housing_prepared)
tree_mse = mean_squared_error(housing_labels, housing_predictions)
tree_rmse = np.sqrt(tree_mse)

>>>tree_rmse
0.0
均方误差为0! 接下来需要验证是否 overfitting!
使用交叉验证集
K 折交叉验证(K-fold cross-validation):它随机地将训练集分成十个不同的子集,成为“折”,然后训练评估决策树模型 10 次,每次选一个不用的折来做评估,用其它 9 个来做训练。结果是一个包含 10 个评分的数组:
from sklearn.model_selection import cross_val_score
tree_scores = cross_val_score(tree_reg, housing_prepared, housing_labels, scoring="neg_mean_squared_error", cv=10)
tree_rmse_scores = np.sqrt(-tree_scores)
def display_scores(scores):
print("Scores:", scores)
print("Mean:", scores.mean())
print("Standard deviation:", scores.std())
>>>display_scores(tree_rmse_scores)
Scores: [ 68985.01395695 65172.5634159 71793.96098952 70262.0308856
71388.50187475 75207.35682643 71424.78428879 70963.87017133
75989.77372172 70526.94284737]
Mean: 71171.4798978
Standard deviation: 2864.5464196看一下线性模型使用交叉验证集的详细误差分析
lin_scores = cross_val_score(lin_reg, housing_prepared, housing_labels, scoring="neg_mean_squared_error", cv=10)
lin_rmse_scores = np.sqrt(-lin_scores)

>>>display_scores(lin_rmse_scores)
Scores: [ 66782.73843989  66960.118071    70361.18285107  74742.02420674
  68022.09224176  71191.82593104  64969.63056405  68276.69992785
  71543.69797334  67665.10082067]
Mean: 69051.5111027
Standard deviation: 2732.29380552
使用随机森林回归
from sklearn.ensemble import RandomForestRegressor

forest_reg = RandomForestRegressor()
forest_reg.fit(housing_prepared, housing_labels)
forest_scores = cross_val_score(forest_reg, housing_prepared, housing_labels,
scoring="neg_mean_squared_error", cv=10)
forest_rmse_scores = np.sqrt(-forest_scores)

>>>display_scores(forest_rmse_scores)
Scores: [ 51391.81431233  51334.6685017   50237.29658917  54104.40687686
  52512.65783587  56565.53017828  51138.4544932   49768.13676088
  55584.97356508  52263.74629625]
Mean: 52490.168541
Standard deviation: 2137.69761848
可以用 Python 的模块pickle,非常方便地保存 Scikit-Learn 模型,或使用sklearn.externals.joblib,后者序列化大 NumPy 数组更有效率:
from sklearn.externals import joblib

joblib.dump(my_model, "my_model.pkl")
my_model_loaded = joblib.load("my_model.pkl")
参数调节
网格搜索 寻找最佳参数组合
from sklearn.model_selection import GridSearchCV

param_grid = [
    {'n_estimators': [3, 10, 30], 'max_features': [2, 4, 6, 8]},
    {'bootstrap': [False], 'n_estimators': [3, 10], 'max_features': [2, 3, 4]},
]

forest_reg = RandomForestRegressor()
grid_search = GridSearchCV(forest_reg, param_grid, cv=5, scoring='neg_mean_squared_error')
grid_search.fit(housing_prepared, housing_labels)
查看最优参数寻找过程
cvres = grid_search.cv_results_
for mean_score, params in zip(cvres["mean_test_score"], cvres["params"]):
    print(np.sqrt(-mean_score), params)

------
63636.381499 {'max_features': 2, 'n_estimators': 3}
55508.4365729 {'max_features': 2, 'n_estimators': 10}
53065.9556758 {'max_features': 2, 'n_estimators': 30}
60569.2536706 {'max_features': 4, 'n_estimators': 3}
52452.5543768 {'max_features': 4, 'n_estimators': 10}
50423.4567781 {'max_features': 4, 'n_estimators': 30}
59155.6301367 {'max_features': 6, 'n_estimators': 3}
52428.3482833 {'max_features': 6,
'n_estimators': 10}
50087.0938275 {'max_features': 6, 'n_estimators': 30}
57956.8499908 {'max_features': 8, 'n_estimators': 3}
51985.5104956 {'max_features': 8, 'n_estimators': 10}
49957.4329702 {'max_features': 8, 'n_estimators': 30}
63477.3713255 {'bootstrap': False, 'max_features': 2, 'n_estimators': 3}
53868.6334087 {'bootstrap': False, 'max_features': 2, 'n_estimators': 10}
60115.070207 {'bootstrap': False, 'max_features': 3, 'n_estimators': 3}
52619.0252901 {'bootstrap': False, 'max_features': 3, 'n_estimators': 10}
58302.8842937 {'bootstrap': False, 'max_features': 4, 'n_estimators': 3}
51157.9855958 {'bootstrap': False, 'max_features': 4, 'n_estimators': 10}
查看最优参数
>>>grid_search.best_params_
{'max_features': 8, 'n_estimators': 30}
>>>grid_search.best_estimator_
RandomForestRegressor(bootstrap=True, criterion='mse', max_depth=None,
max_features=8, max_leaf_nodes=None, min_impurity_decrease=0.0,
min_impurity_split=None, min_samples_leaf=1,
min_samples_split=2, min_weight_fraction_leaf=0.0,
n_estimators=30, n_jobs=1, oob_score=False, random_state=None,
verbose=0, warm_start=False)
当探索相对较少的组合时,就像前面的例子,网格搜索还可以。但是当超参数的搜索空间很大时,最好使用RandomizedSearchCV。这个类的使用方法和类GridSearchCV很相似,但它不是尝试所有可能的组合,而是通过选择每个超参数的一个随机值的特定数量的随机组合。这个方法有两个优点:
可以方便地通过设定搜索次数,控制超参数搜索的计算量。如果你让随机搜索运行,比如 1000 次,它会探索每个超参数的 1000 个不同的值(而不是像网格搜索那样,只搜索每个超参数的几个值)。
from sklearn.model_selection import RandomizedSearchCV
from scipy.stats import expon, reciprocal

# see https://docs.scipy.org/doc/scipy-0.19.0/reference/stats.html
# for `expon()` and `reciprocal()` documentation and more probability distribution functions.

# Note: gamma is ignored when kernel is "linear"
param_distribs = {
        'kernel': ['linear', 'rbf'],
        'C': reciprocal(20, 200000),
        'gamma': expon(scale=1.0),
    }

svm_reg = SVR()
rnd_search = RandomizedSearchCV(svm_reg, param_distributions=param_distribs,
                                n_iter=30, cv=5, scoring='neg_mean_squared_error',
                                verbose=2, n_jobs=4, random_state=42)
rnd_search.fit(housing_prepared, housing_labels)
# 一共 30*5 fits

Fitting 5 folds for each of 50 candidates, totalling 250 fits
[CV] C=629.782329591, gamma=3.01012143092, kernel=linear .............
[CV] C=629.782329591, gamma=3.01012143092, kernel=linear .............
[CV] C=629.782329591, gamma=3.01012143092, kernel=linear .............
[CV] C=629.782329591, gamma=3.01012143092, kernel=linear .............
[CV]  C=629.782329591, gamma=3.01012143092, kernel=linear, total=   8.2s
[CV] C=629.782329591, gamma=3.01012143092, kernel=linear .............
[CV]  C=629.782329591, gamma=3.01012143092, kernel=linear, total=   8.3s
[CV] C=26290.2064643, gamma=0.908446969632, kernel=rbf ...............
[CV]  C=629.782329591, gamma=3.01012143092, kernel=linear, total=   8.3s
[CV] C=26290.2064643, gamma=0.908446969632, kernel=rbf ...............
[CV]  C=629.782329591, gamma=3.01012143092, kernel=linear, total=   8.3s
[CV] C=26290.2064643, gamma=0.908446969632, kernel=rbf ...............
[CV]  C=629.782329591, gamma=3.01012143092, kernel=linear, total=   7.3s
[CV] C=26290.2064643, gamma=0.908446969632, kernel=rbf ...............
[CV]  C=26290.2064643, gamma=0.908446969632, kernel=rbf, total=  12.3s
......
在测试集上对模型进行评估
final_model = grid_search.best_estimator_

X_test = strat_test_set.drop("median_house_value", axis=1)
y_test = strat_test_set["median_house_value"].copy()

X_test_prepared = full_pipeline.transform(X_test)
final_predictions = final_model.predict(X_test_prepared)
final_mse = mean_squared_error(y_test, final_predictions)
final_rmse = np.sqrt(final_mse)

>>>final_rmse
48237.95545767661


