$(function () {
    $('#container').highcharts({
        chart: {
            type: 'line'
        },
        title: {
            text: '月平均气温'
        },
        subtitle: {
            text: '数据来源: WorldClimate.com'
        },
        xAxis: {
            categories: ['一月', '二月', '三月', '四月', '五月', '六月', '七月', '八月', '九月', '十月', '十一月', '十二月']
        },
        yAxis: {
            title: {
                text: '气温 (°C)'
            }
        },
        plotOptions: {
            line: {
                dataLabels: {
                    enabled: true          // 开启数据标签
                },
                enableMouseTracking: false // 关闭鼠标跟踪,对应的提示框、点击事件会失效
            }
        },
        series: [{
            name: '东京',
            data: [7.0, 6.9, 9.5, 14.5, 18.4, 21.5, 25.2, 26.5, 23.3, 18.3, 13.9, 9.6]
        }, {
            name: '伦敦',
            data: [3.9, 4.2, 5.7, 8.5, 11.9, 15.2, 17.0, 16.6, 14.2, 10.3, 6.6, 4.8]
        }]
    });
});
<div id="container" style="min-width:400px;height:400px">div>
//外部引入
<link rel="icon" href="https://static.jianshukeji.com/hcode/images/favicon.ico">
    <script type="text/javascript" src="https://img.hcharts.cn/jquery/jquery-1.8.3.min.js">script>
    <script type="text/javascript" src="https://img.hcharts.cn/highcharts/highcharts.js">script>
    <script type="text/javascript" src="https://img.hcharts.cn/highcharts/highcharts-more.js">script>
    <script type="text/javascript" src="https://img.hcharts.cn/highcharts-plugins/highcharts-zh_CN.js">script>
//这里是我自定义三十天日期的数组  还有 处理对应格式数据的方法
 var myDate = new Date(); //获取今天日期
           myDate.setDate(myDate.getDate() - 30);
           var dateTemp;
           var flag = 1;
           for (var i = 0; i < 30; i++) {
                dateTemp = (myDate.getMonth()+1)+"月"+myDate.getDate()+'日';
                dayArray.push(dateTemp);
                myDate.setDate(myDate.getDate() + flag);
            }
                    for (var i = 0; i < 30; i++) {
                 dateTemp = (myDate.getMonth()+1)+"月"+myDate.getDate()+'日';
                 sevenArray.push(dateTemp);
                 myDate.setDate(myDate.getDate() + flag);
             }
                    for (var i = 0; i < 24; i++) {
                 dateTemp = 1+"时";
                 timeArray.push(dateTemp);
                 myDate.setDate(myDate.getDate() + flag);
             }
 var day = new Date(item.receivetime).getMonth()+1+"月"+new Date(item.receivetime).getDate()+'日';
                         // console.log(item.totalsteps.split('|'));
                        //  console.log(day);
                         var steps = item.totalsteps.split('|');
                            data.data.forEach(function(item){

                                if(obj[day]){
                                     obj[day]+=Number(steps[steps.length-1])
                                    //  stepss.push(steps)
                                }else{
                                        obj[day]=Number(steps[steps.length-1])
                                }
                        })
                        // console.log(dayArray) ;
                });
                // console.log(obj)
                dayArray.forEach(function(item){

                    if(obj[item]){
                        // console.log(obj[item]);
                        totalsteps.push(obj[item]);

                    }else{
                        totalsteps.push(0); //每天步数
                    }
                });
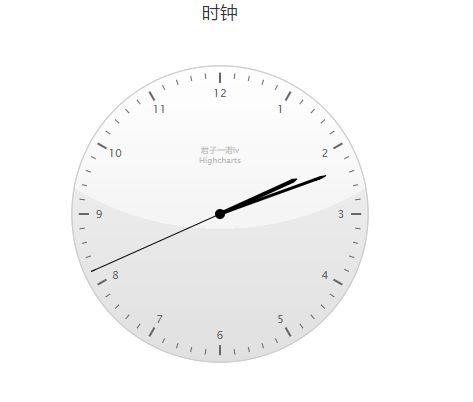
感觉最烦的就是处理数据了,给一打数据。 每个公司的套路不同,我也没法完全展现 下面是时钟的
<div id="container" style="width: 400px; height: 400px; margin: 0 auto">div>

