周志华机器学习 CH3.5 编程实现线性判别分析
方法一:利用sklearn库函数实现
import numpy as np
import matplotlib.pyplot as plt

'''
# LDA via sklearn
'''
from sklearn import model_selection
from sklearn.discriminant_analysis import LinearDiscriminantAnalysis
from sklearn import metrics

fr = open("3.0.txt")
dataSet = np.loadtxt(fr, delimiter = ",")
X = dataSet[:, 1:3]
Y = dataSet[:, 3]


# draw scatter diagram to show the raw data
f1 = plt.figure(1)
plt.title('watermelon_3a')
plt.xlabel('density')
plt.ylabel('ratio_sugar')
plt.scatter(X[Y == 0,0], X[Y == 0,1], marker = 'o', color = 'k', s=100, label = 'bad')
plt.scatter(X[Y == 1,0], X[Y == 1,1], marker = 'o', color = 'g', s=100, label = 'good')
plt.legend(loc = 'upper right')

X_train,X_test,Y_train,Y_test=model_selection.train_test_split(X,Y,test_size=0.5,random_state = 0)


#进行拟合
lda_model=LinearDiscriminantAnalysis(solver = 'lsqr',shrinkage = None).fit(X,Y)

y_pred=lda_model.predict(X_test)

print(metrics.confusion_matrix(Y_test,y_pred))
print(metrics.classification_report(Y_test,y_pred))


#画出决策边界
f2=plt.figure(2)
h=0.01
X0_min,X0_max=X[:,0].min()-0.1,X[:,0].max()+0.1
X1_min,X1_max=X[:,1].min()-0.1,X[:,1].max()+0.1
X0,X1=np.meshgrid(np.arange(X0_min,X0_max,h),np.meshgrid(np.arange(X1_min,X1_max,h)))
z=lda_model.predict(np.c_[X0.ravel(),X1.ravel()])
print(z.shape)
#  Put the result into a color plot
print(X0.shape)
z=z.reshape(X0.shape)
print(z)

print(z.shape)
plt.contour(X0,X1,z)

# Plot also the training pointsplt.title('watermelon_3a')
plt.title('watermelon_3a')
plt.xlabel('density')
plt.ylabel('ratio_sugar')
plt.scatter(X[Y == 0,0], X[Y == 0,1], marker = 'o', color = 'k', s=100, label = 'bad')
plt.scatter(X[Y == 1,0], X[Y == 1,1], marker = 'o', color = 'g', s=100, label = 'good')
plt.show()
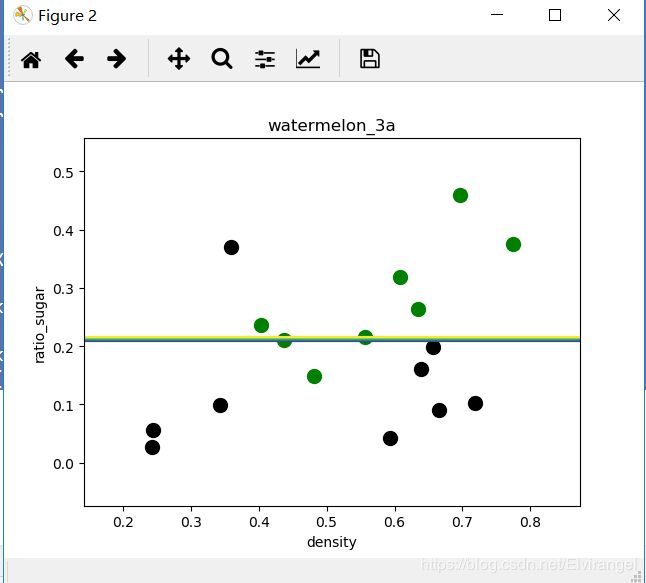
运行结果:
方法二:利用python自己编程实现
import numpy as np
import matplotlib.pyplot as plt

def loadDataSet(fileName):
    '''
    fr=open(fileName)
    X=[];Y=[]
    for line in fr.readlines():
        lineArr=line.strip().split(',')
        X.append([float(lineArr[1]),float(lineArr[2])])
        Y.append(lineArr[3])
    '''
    fr=open(fileName)
    dataSet=np.loadtxt(fr,delimiter=",")
    X=dataSet[:,1:3]
    Y=dataSet[:,3]

    print(type(X),type(Y))
    return np.array(X),np.array(Y)

def plotDataSet(X,Y):
    # 绘制数据集
    f1 = plt.figure()
    plt.title("watermelon_3a")
    plt.xlabel("密度")
    plt.ylabel("含糖量")
    plt.scatter(X[Y == 0, 0], X[Y == 0, 1], marker = 'o', color = 'k', s = 100, label = 'bad')
    plt.scatter(X[Y == 1, 0], X[Y == 1, 1], marker = 'o', color = 'g', s = 100, label = 'good')
    plt.legend(loc = 'upper right')
    plt.show()

# 求类内散度矩阵
def Sw(X,Y):
    u=[]
    u.append(np.mean(X[Y==0],axis=0))  #column means
    u.append(np.mean(X[Y==1],axis=0))
    u=np.array(u)
    m,n=np.shape(X)
    sw=np.zeros((n,n))

    X0=X[Y==0]
    X1=X[Y==1]
    #  !!!!!
    # 一定注意要把u变成矩阵!!!!
    # 因为u.shape=(1,2),直接u.T转置还是一个一维的数组,参与运算出错!!
    # 因为u=[1,2],u.T=[1,2]
    # 变成矩阵u=[[1,2]],u.T=[[1],[2]]
    # 弄了一天!!才发现这里出了问题!!!!
    #(或者:u=u.reshape((2,1)),这样之后在转置,和np.mat(u)效果一样!)

    for i in range(np.shape(X0)[0]):
        sw+=np.dot(np.mat((X0[i]-u[0])).T,np.mat(X0[i]-u[0]))
    for i in range(np.shape(X1)[0]):
        sw+=np.dot(np.mat((X1[i]-u[1])).T,np.mat(X1[i]-u[1]))
    '''

    for i in range(m):
        if Y[i]==0:
            x_temp=X[i]-u[0]
            print("temp= ",np.array(x_temp).T,"temp.T= ",(x_temp))
        else:

            x_temp=X[i]-u[1]
           # print(x_temp.T)
        sw+=np.dot(np.mat(x_temp).T,np.mat(x_temp))
        print(i, "  ", sw)
            '''
    print(sw)
    return sw,u


#计算w
def wFunction(sw,u):
    m,n=np.shape(X)
    sw_inv=np.linalg.pinv(sw)
    w=np.dot(sw_inv,(u[0]-u[1]).T)
    return w

# draw projective point on the line
# 计算投影点的坐标,
# 利用直线和垂直线的斜率相乘=1,求两直线交点坐标
def GetProjectivePoint_2D(point, line):
    a = point[0]
    b = point[1]
    k = line[0]
    t = line[1]
    if   k == 0:      return [a, t] # 平行于横轴
    elif k == np.inf: return [0, b] # 平行于纵轴
    x = (a+k*b-k*t) / (k*k+1)  #斜线
    y = k*x + t
    return [x, y]


if __name__=="__main__":
    X,Y=loadDataSet("3.0.txt")
    #print(X)
    #print(Y)
    #plotDataSet(X,Y)
    sw,u=Sw(X,Y)
    w=wFunction(sw,u)
    print(w)

    f2 = plt.figure(2)

    p0_x0 = -X[:, 0].max()
    p0_x1 = (-w[0]/w[1])*p0_x0
    p1_x0 = X[:, 0].max()
    p1_x1 = (-w[0]/w[1])*p1_x0
    plt.title('watermelon_3a - LDA')
    plt.xlabel('density')
    plt.ylabel('ratio_sugar')
    plt.scatter(X[Y == 0, 0], X[Y == 0, 1], marker = 'o', color = 'k', s = 10, label = 'bad')
    plt.scatter(X[Y == 1, 0], X[Y == 1, 1], marker = 'o', color = 'g', s = 10, label = 'good')
    plt.legend(loc = 'upper right')
    plt.plot([p0_x0, p1_x0], [p0_x1, p1_x1])

    m, n = np.shape(X)
    for i in range(m):
        x_p = GetProjectivePoint_2D([X[i][0], X[i][1]], [-w[0]/w[1], 0])
        if Y[i] == 0:
            plt.plot(x_p[0], x_p[1], 'ko', markersize = 5)
        if Y[i] == 1:
            plt.plot(x_p[0], x_p[1], 'go', markersize = 5)
        plt.plot([x_p[0], X[i, 0]], [x_p[1], X[i, 1]], 'c--', linewidth = 0.3)
    plt.show()
运行结果:
删除一个离群的训练样本后,得以改善:


