python用matplotlib画条形图初探(单变量,双变量堆叠)
一、包
import numpy as np
import matplotlib.pyplot as plt
二、单变量(垂直)
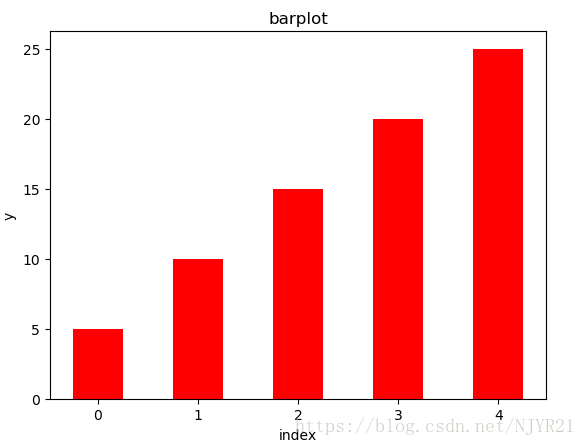
y = [5, 10, 15, 20, 25]
index = np.arange(len(y))
plt.bar(left=index, height=y, color='r', width=0.5)  # 水平对应left&height, weidth表示bar的宽度
# plt.xlim(index.min(), index.max()+1) 设定x轴的范围
# plt.ylim(min(y), max(y)+5)
plt.xlabel('index')
plt.ylabel('y')
plt.title('barplot')
plt.show()
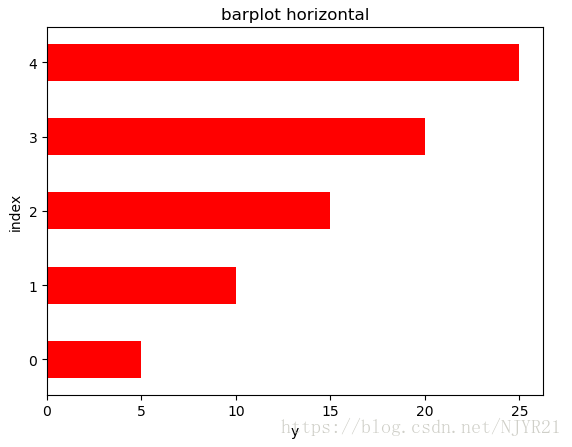
三、单变量(水平)
plt.bar(left=0, bottom=index, width=y, color='red', height=0.5, orientation='horizontal') # 水平对应bottom&width, height表示bar的宽度
plt.ylabel('index')
plt.xlabel('y')
plt.title('barplot horizontal')
plt.show()

# barh可以省略orientation参数的设定
plt.barh(left=0, bottom=np.arange(len(y)), width=y, color='red', height=0.5)
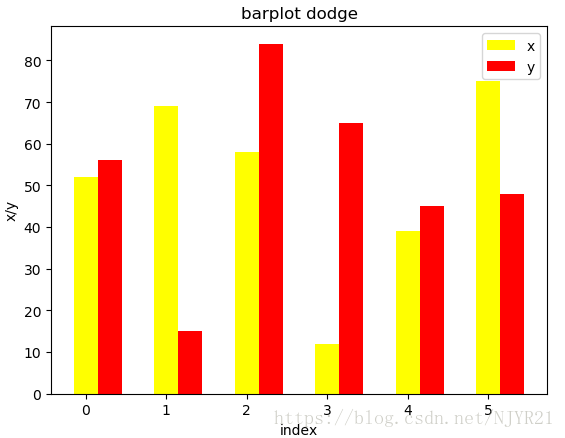
四、双变量(dodge)
x = [52, 69, 58, 12, 39, 75]
y = [56, 15, 84, 65, 45, 48]
index = np.arange(len(x))
width = 0.3

plt.bar(left=index, height=x, width=width, color='yellow', label=u'x')
plt.bar(left=index+width, height=y, width=width, color='red', label=u'y') # width=index+width 表示从向右x平移width的单位,刚好靠在一起
plt.xlabel('index')
plt.ylabel('x/y')
plt.title('barplot dodge')
plt.legend(loc='best')
plt.show()
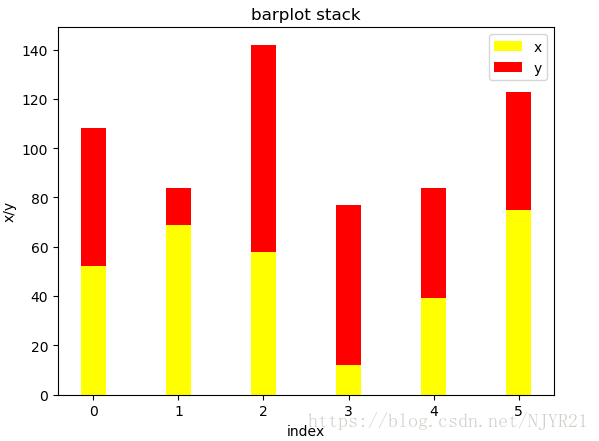
五、双变量(stack)
plt.bar(left=index, height=x, width=width, color='yellow', label=u'x')
plt.bar(left=index, height=y, width=width, color='red', bottom=x, label=u'y') # bottom=x,表示从x的值开始堆叠上去
plt.xlabel('index')
plt.ylabel('x/y')
plt.title('barplot stack')
plt.legend(loc='best')
plt.show()