matplotlib画图- 时间序列折线图
今天做了一下毕设的图(关于结果比较的 时间序列图)
- 首先我说明 找了半天的博客 没有找到好的方法做x轴为datetime,很麻烦 所以我打算做int32类型的,但发现没法转换 结果采用特殊方法解决的
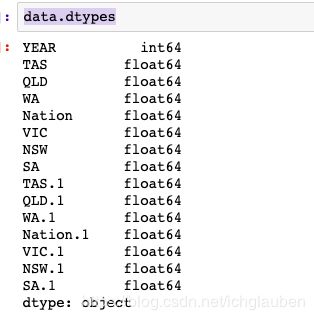
1.数据集查看
2.将year转换为index
a = data.set_index(['YEAR'])
a.index
Int64Index([2011, 2012, 2013, 2014], dtype='int64', name='YEAR')
3. 转存数据
TAS = a.iloc[:,0]
QLD = a.iloc[:,1]
WA = a.iloc[:,2]
NATION = a.iloc[:,3]
VIC = a.iloc[:,4]
NSW = a.iloc[:,5]
SA = a.iloc[:,6]
TAS1 = a.iloc[:,7]
QLD1= a.iloc[:,8]
WA1 = a.iloc[:,9]
NATION1 = a.iloc[:,10]
VIC1 = a.iloc[:,11]
NSW1=a.iloc[:,12]
SA1=a.iloc[:,13]
3.plot
- 注意 :解决 设置xy轴的刻度
xticks和yticks进行限制
plt.figure(1)

#plt.subplot(221)
plt.plot(TAS.index.values,TAS.values,'o-k')
plt.plot(QLD.index.values,QLD.values,'o-')
plt.plot(WA.index.values,WA.values,'o-y')
plt.plot(NATION.index.values,NATION.values,'o-c')
plt.plot(VIC.index.values,VIC.values,'o-r')
plt.plot(NSW.index.values,NSW.values,'o-g')
plt.plot(SA.index.values,SA.values,'o-m')
plt.axis([2011,2014,0.04,0.18])
#设置横纵坐标的刻度
#------标位置名称 图例
plt.xticks(np.arange(2011,2015,1))
plt.yticks(np.arange(0.04,0.20,0.02))
plt.text(2014,0.108,'TAS')
plt.text(2014,0.09,'QLD')
plt.text(2014,0.08,'WA')
plt.annotate('NATION',xytext=(2014,0.12),xy=(2014,0.076),arrowprops=dict(arrowstyle="->"))
plt.annotate('VIC',xytext=(2014,0.04),xy=(2014,0.075),arrowprops=dict(arrowstyle="->"))
plt.text(2014,0.07,'NSW')
plt.text(2014,0.06,'SA')
plt.ylabel("RMSE")
plt.xlabel("(a) LSTM")
plt.grid(True)

#
plt.figure(2)
#plt.subplot(222)
plt.plot(TAS1.index.values,TAS1.values,'o-k')
plt.plot(QLD1.index.values,QLD1.values,'o-')
plt.plot(WA1.index.values,WA1.values,'o-y')
plt.plot(NATION1.index.values,NATION1.values,'o-c')
plt.plot(VIC1.index.values,VIC1.values,'o-r')
plt.plot(NSW1.index.values,NSW1.values,'o-g')
plt.plot(SA1.index.values,SA1.values,'o-m')

plt.axis([2011,2014,0.04,0.18])
#设置横纵坐标的刻度
#------标位置名称 图例
plt.xticks(np.arange(2011,2015,1))
plt.yticks(np.arange(0.04,0.20,0.02))
plt.text(2011,0.11,'TAS')
plt.text(2011,0.15,'QLD')
plt.text(2011,0.102,'WA')
#plt.annotate('NATION',xytext=(2014,0.12),xy=(2014,0.126),arrowprops=dict(arrowstyle="->"))
#plt.annotate('VIC',xytext=(2014,0.10),xy=(2014,0.15),arrowprops=dict(arrowstyle="->"))
plt.text(2011,0.12,'NATION')
plt.text(2011,0.14,'VIC')
plt.text(2011,0.09,'NSW')
plt.text(2011,0.08,'SA')
plt.grid(True)
plt.ylabel("RMSE")
plt.xlabel("(b) SE")

plt.show()
plt.savefig('example.jpg',format='jpg')
matplotlib绘制折线图,包含添加标签


