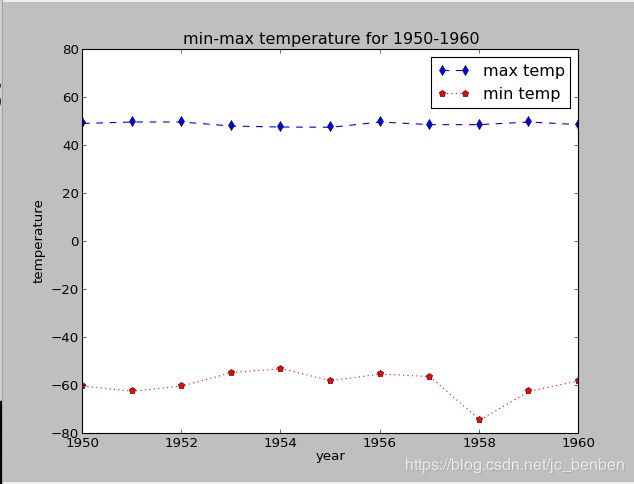
使用python处理美国气象数据
1,下载,可以使用wget或者python,这里是python2.7的版本
说明:这里是下载目录ftp://ftp.ncdc.noaa.gov/pub/data/noaa/的原始没有处理过的文件,如果想要看处理过的从这个目录下载ftp://ftp.ncdc.noaa.gov/pub/data/noaa/isd-lite/
python:
#!/usr/bin/python
# -*- coding: utf-8 -*-
import os
from ftplib import FTP


# ftp 服务器链接
def ftpconnect():
    ftp_server = 'ftp.ncdc.noaa.gov'
    username = ''
    password = ''
    ftp = FTP()
   # ftp.set_debuglevel(2)  # 打开调试级别2,显示详细信息
    ftp.connect(ftp_server, 21)  # 连接
    ftp.login(username, password)  # 登录,如果匿名登录则用空串代替即可
    return ftp
    # 开始下载文件


def downloadfile(start, end, srcpath):
    ftp = ftpconnect()
    # print ftp.getwelcome() #显示ftp服务器欢迎信息
    datapath = "/pub/data/noaa/"
    while start <= end:
        path = datapath + str(start)
        li = ftp.nlst(path)

        # 创建指定年份的目录
        path = srcpath + '/' # G:\hadp\data2/
        dir = str(start) #1950
        new_path = os.path.join(path, dir)
        if not os.path.isdir(new_path):
            os.makedirs(new_path)

        for eachFile in li:
            print('STARTUP----------')
            #print(eachFile)
            localpaths = eachFile.split("/")
            localpath = localpaths[len(localpaths) - 1]
            localpath = new_path + '/' + str(start) + '--' + localpath  # 把日期放在最前面,方便排序
            bufsize = 1024  # 设置缓冲块大小
            fp = open(localpath, 'wb')  # 以写模式在本地打开文件
            ftp.retrbinary('RETR ' + eachFile, fp.write, bufsize)  # 接收服务器上文件并写入本地文件
            #print('END----------')
        start = start + 1
   # ftp.set_debuglevel(0)  # 关闭调试
    ftp.close()
    ftp.quit()  # 退出ftp服务器
if __name__ == "__main__":
    downloadfile(1950, 1960, "/root/hadoop/data2")
也可以使用wget
wget -r -c fttp://ftp.ncdc.noaa.gov/pub/data/noaa/19502,解压,分析,绘图
2.1解压读取,功能室将gz文件的内容读出来reader.py
#!/usr/bin/python
# -*- coding: utf-8 -*-
import os
import gzip

def reader():

    curpath = os.getcwd()
    datapath = os.path.join(curpath, r"data3")

    for yearlist in os.listdir(datapath):
        oneyearpath = os.path.join(datapath, yearlist)
        datalist = os.listdir(oneyearpath)
        for line in datalist:
            onedatapath = os.path.join(oneyearpath, line)
            print onedatapath
            with gzip.open(onedatapath, 'rb') as pf:
                print (pf.read())

def main():
    reader()

if __name__=="__main__":
    main()
2.2,mapper作用,将数据处理成 "year \n temperature"的输出形式
#!/usr/bin/python
# -*- coding:utf-8 -*-
import sys
import re

def mapper(inlist):
    for line in inlist:
        if len(line) > 92:
            year = (line[15:19])

            if line[88:92] != '9999' and re.match(r'[01459]',line[92:93]):
                if line[87] == '+':
                        temperataure = line[88:92]
                else:
                        temperataure = line[87:92]
            else:
                temperataure = None
            print year, temperataure

def main(inlist):
    mapper(inlist)

if __name__=="__main__":
    inlist = []
    for line in sys.stdin:
        inlist.append(line)
    main(inlist)
2.3,reducer,将mapper中的输出数据整理并计算每年的最高、低温度,并输出
[root@centos7 hadoop]# cat reducer.py
#!/usr/bin/python
# -*- coding: utf-8 -*-
import sys

def reducer(inlist):
    cur_year = None
    maxtemp = None
    mintemp = None
    for line in inlist:
        year, temp = line.split()
        try:
            temp = int(temp)
        except ValueError:
            continue
        if cur_year == year:
            if temp > maxtemp:
                maxtemp = temp
            if temp < mintemp:
                mintemp = temp
        else:
            if cur_year != None:
                print cur_year, maxtemp, mintemp
            cur_year = year
            maxtemp = temp
            mintemp = temp
    print cur_year, maxtemp, mintemp

def main(inlist):
    reducer(inlist)

if __name__=="__main__":
    inlist = []
    for line in sys.stdin:
        inlist.append(line)
    main(inlist)
2.4 画图,这里使用python的matlab模块,安装(yum install python-matplotlib)
[root@centos7 hadoop]# cat drawer.py
#!/usr/bin/python
# -*- coding:utf-8 -*-

import sys
import matplotlib.pyplot as plt

def drawer(inlist):
    yearlist = []
    maxtemplist = []
    mintemplist = []
    for line in inlist:
        year, maxtemp, mintemp = line.split()
        try:
            year = int(year)
            maxtemp = int(maxtemp) / 10.
            if(maxtemp) > 50:
                maxtemp = 50
            mintemp = int(mintemp) / 10.
        except ValueError:
            continue
        yearlist.append(year)
        maxtemplist.append(maxtemp)
        mintemplist.append(mintemp)
    plt.plot(yearlist, maxtemplist, 'bd--')
    plt.plot(yearlist, mintemplist, 'rp:')
    plt.xlim(1950, 1960)
    plt.ylim(-80, 80)
    plt.title('min-max temperature for 1950-1960')
    plt.xlabel('year')
    plt.ylabel('temperature')
    plt.legend(('max temp','min temp'), loc='upper right')
    plt.show()
    print(yearlist, maxtemplist, mintemplist)

def main(inlist):
    drawer(inlist)

if __name__=="__main__":
    inlist = []
    for line in sys.stdin:
        inlist.append(line)
    main(inlist)
执行&查看 :./reader.py | ./map.py | ./reducer.py | ./drawer.py
原书中提供了使用awk脚本获取最高气温逻辑:
#!/usr/bin/env bash
for year in all/*
do
  echo -ne `basename $year .gz`"\t"
  gunzip -c $year | \
    awk '{ temp = substr($0, 88, 5) + 0;
           q = substr($0, 93, 1);
           if (temp !=9999 && q ~ /[01459]/ && temp > max) max = temp }
         END { print max }'
done
参考:
https://www.cnblogs.com/kereturn/p/mapreduce.html
《hadoop权威指南》
