SpringBoot 应用健康监控之SpringBoot Admin
目录
1、什么是Spring Boot Admin
2、实践方案
2.1、基于SpringCloud的 Eureka方式实现对注册微服务进行监控
搭建注册中心
搭建admin-server
搭建admin-client
2.2、单体SpringBoot直接监控方式
创建Spring Boot Admin Server
创建Spring Boot Admin Client
3、开源项目spring-boot-plus单微服务监控实践
4、总结
5、参考文章
1、什么是Spring Boot Admin
Spring Boot Admin是一个开源社区项目,用于管理和监控SpringBoot应用程序。 应用程序作为Spring Boot Admin Client向为Spring Boot Admin Server注册(通过HTTP)或使用SpringCloud注册中心(例如Eureka,Consul)发现。 UI是的AngularJs应用程序,展示Spring Boot Admin Client的Actuator端点上的一些监控。常见的功能或者监控如下:
- 显示健康状况
- 显示详细信息,例如
- JVM和内存指标
- micrometer.io指标
- 数据源指标
- 缓存指标
- 显示构建信息编号
- 关注并下载日志文件
- 查看jvm系统和环境属性
- 查看Spring Boot配置属性
- 支持Spring Cloud的postable / env-和/ refresh-endpoint
- 轻松的日志级管理
- 与JMX-beans交互
- 查看线程转储
- 查看http跟踪
- 查看auditevents
- 查看http-endpoints
- 查看计划任务
- 查看和删除活动会话(使用spring-session)
- 查看Flyway / Liquibase数据库迁移
- 下载heapdump
- 状态变更通知(通过电子邮件,Slack,Hipchat,......)
- 状态更改的事件日志(非持久性)
Spring Boot Admin(下文简称SBA)是一个社区开源项目,用于管理和监控你的Spring Boot应用。 应用通过SBA Client注册到SBA Server中,可通过HTTP请求或者Spring Cloud发现(例如Eureka、Consul),UI展示通过Vue在Spring Boot Actuator端点上获取应用监控数据进行管理。使用SpringBoot Admin进行监控,个人目前感觉最为实用的功能是可以在线查看日志功能。
2、实践方案
2.1、基于SpringCloud的 Eureka方式实现对注册微服务进行监控
由于目前中小企业大部分使用的是SpringCloud方式进行相关业务应用进行微服务拆分。本人也查阅了网上的相关资料,以及github上共享的此方案的实现方式。下面将针对此种方式进行说明。
本案例也是使用的是Spring Boot版本为2.1.6 、Spring Cloud版本为Finchley.SR2。案例采用Maven多module形式,父pom文件引入以下的依赖(完整的依赖见源码),此处省略。
搭建注册中心
注册中心使用Eureka、使用Consul也是可以的,在eureka-server工程中的pom文件中引入:
    org.springframework.cloud
    spring-cloud-starter-netflix-eureka-server
配置eureka-server的端口信息,以及defaultZone和防止自注册。最后系统暴露eureka-server的actuator的所有端口。
spring:
  application:
    name: eureka-server
server:
  port: 8761
eureka:
  client:
    service-url:
      defaultZone: http://localhost:8761/eureka
    register-with-eureka: false
    fetch-registry: false
management:
  endpoints:
    web:
      exposure:
        include: "*"
  endpoint:
    health:
      show-details: ALWAYS
在工程的启动文件EurekaServerApplication加上@EnableEurekaServer注解开启Eureka Server.
@SpringBootApplication
@EnableEurekaServer
public class EurekaServerApplication {

    public static void main(String[] args) {
        SpringApplication.run( EurekaServerApplication.class, args );
    }
}
eureka-server搭建完毕。
搭建admin-server
在admin-server工程的pom文件引入admin-server的起步依赖、web的起步依赖、eureka-client的起步依赖,如下:
    de.codecentric
    spring-boot-admin-starter-server
    2.1.6


    org.springframework.boot
    spring-boot-starter-web


    org.springframework.cloud
    spring-cloud-starter-netflix-eureka-client
然后配置admin-server,应用名、端口信息。并向注册中心注册,注册地址为http://localhost:8761,最后将actuator的所有端口暴露出来,配置如下
server:
  port: 8769
spring:
  application:
    name: sc-admin-server
  security:
    user:
      name: "admin"
      password: "admin"

  mail:
    host: smtp.163.com
    username: [email protected]
    password: xxxx
    properties:
      mail:
        smtp:
          auth: true
          starttls:
            enable: true
            required: true
  boot:
    admin:
      notify:
        mail:
          from: [email protected]
          to: [email protected]
eureka:
  client:
    registryFetchIntervalSeconds: 5
    service-url:
      defaultZone: ${EUREKA_SERVICE_URL:http://localhost:8761}/eureka/
  instance:
    leaseRenewalIntervalInSeconds: 10
    health-check-url-path: /actuator/health
    metadata-map:
      user.name: ${spring.security.user.name}
      user.password: ${spring.security.user.password}

logging:
    file: ${spring.application.name}/logs/sc-admin-server.log
    file.level.root: INFO
    file.max-history: 15
    file.max-size: 10MB
    file.pattern:
        console: "%clr(%d{yyyy-MM-dd HH:mm:ss.SSS}){faint} %clr(${LOG_LEVEL_PATTERN:-%5p}) %clr(${PID:- }){magenta} %clr(---){faint} %clr([%15.15t]){faint} %clr(%-40.40logger{39}){cyan} %clr(:){faint} %m%n${LOG_EXCEPTION_CONVERSION_WORD:-%wEx}"
management:
  endpoints:
    web:
      exposure:
        include: "*"
  endpoint:
    health:
      show-details: ALWAYS

  health:
    db:
      enabled: false
    mail:
      enabled: false
    redis:
      enabled: false
    mongo:
      enabled: false
在工程的启动类AdminServerApplication加上@EnableAdminServer注解,开启admin server的功能,加上@EnableDiscoveryClient注解开启eurke client的功能。
@SpringBootApplication
@EnableAdminServer
@EnableDiscoveryClient
public class AdminServerApplication {

    public static void main(String[] args) {
        SpringApplication.run( AdminServerApplication.class, args );
    }

}
搭建admin-client
在admin-client的pom文件引入以下的依赖,由于2.1.7采用webflux,引入webflux的起步依赖,引入eureka-client的起步依赖,并引用actuator的起步依赖如下:
	org.springframework.boot
	spring-boot-starter-webflux


	org.springframework.cloud
	spring-cloud-starter-netflix-eureka-client


	org.springframework.boot
	spring-boot-starter-actuator
在工程的配置文件配置应用名、端口、向注册中心注册的地址,以及暴露actuator的所有端口。
spring:
  application:
    name: sc-admin-client
eureka:
  instance:
    leaseRenewalIntervalInSeconds: 10
    health-check-url-path: /actuator/health

  client:
    registryFetchIntervalSeconds: 5
    service-url:
      defaultZone: ${EUREKA_SERVICE_URL:http://localhost:8761}/eureka/

logging:
  file: ${spring.application.name}/logs/sc-admin-client.log
  file.level.root: INFO
  file.max-history: 15
  file.max-size: 10MB
  file.pattern:
    console: "%clr(%d{yyyy-MM-dd HH:mm:ss.SSS}){faint} %clr(${LOG_LEVEL_PATTERN:-%5p}) %clr(${PID:- }){magenta} %clr(---){faint} %clr([%15.15t]){faint} %clr(%-40.40logger{39}){cyan} %clr(:){faint} %m%n${LOG_EXCEPTION_CONVERSION_WORD:-%wEx}"

management:
  endpoints:
    web:
      exposure:
        include: "*"
  endpoint:
    health:
      show-details: ALWAYS
server:
  port: 8762
在启动类加上@EnableDiscoveryCliet注解,开启DiscoveryClient的功能。
@SpringBootApplication
@EnableDiscoveryClient
public class AdminClientApplication {
public static void main(String[] args) {
SpringApplication.run( AdminClientApplication.class, args );
}
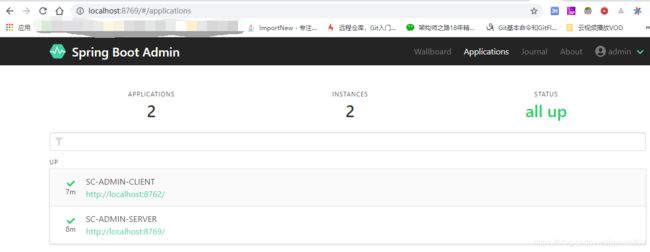
}一次启动三个工程,在浏览器上访问localhost:8761,localhost:8769,localhost::8762显示如下图所示
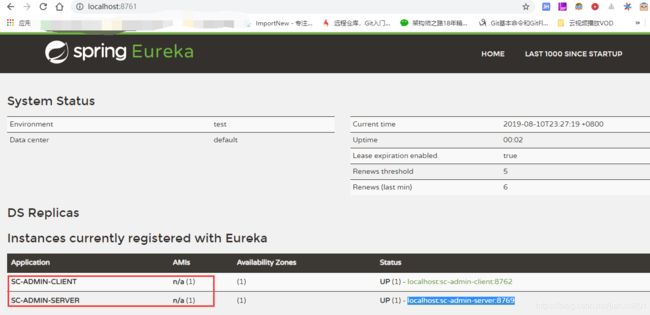
localhost:8769 输入用户名/密码 admin/admin
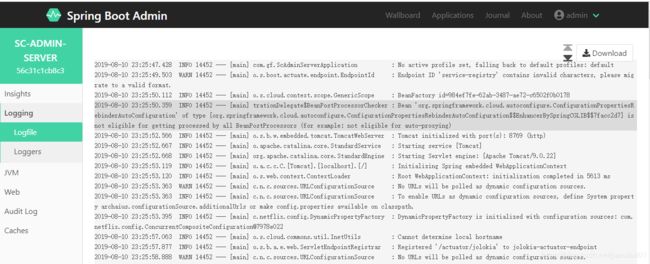
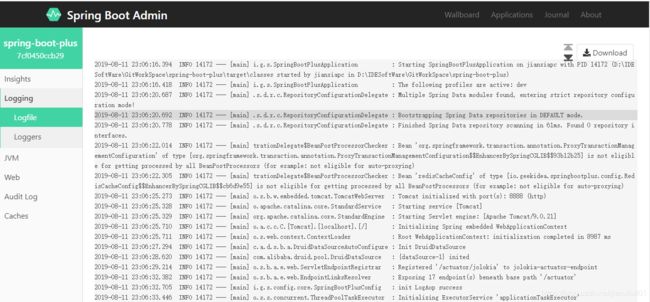
查看sc-admin-server的实时日志文件如下所示
2.2、单体SpringBoot直接监控方式
创建Spring Boot Admin Server
在工程admin-server引入admin-server的起来依赖和web的起步依赖,代码如下:
        org.springframework.boot
        spring-boot-starter-parent
        2.1.7.RELEASE


    com.gf
    admin-server
    0.0.1-SNAPSHOT
    admin-server
    Demo project for Spring Boot


        1.8
        2.1.6


            org.springframework.boot
            spring-boot-starter-web


            de.codecentric
            spring-boot-admin-starter-server


            org.springframework.boot
            spring-boot-starter-test
            test
然后在工程的启动类AdminServerApplication加上@EnableAdminServer注解,开启AdminServer的功能,代码如下:
@SpringBootApplication
@EnableAdminServer
public class AdminServerApplication {

    public static void main(String[] args) {
        SpringApplication.run( AdminServerApplication.class, args );
    }

}
在工程的配置文件application.yml中配置程序名和程序的端口,代码如下:
spring:
  application:
    name: admin-server
server:
  port: 8769
这样Admin Server就创建好了。
创建Spring Boot Admin Client
在admin-client工程的pom文件引入admin-client的起步依赖和web的起步依赖,代码如下:
	de.codecentric
	spring-boot-admin-starter-client
	2.1.6


	org.springframework.boot
	spring-boot-starter-web
在工程的配置文件application.yml中配置应用名和端口信息,以及向admin-server注册的地址为http://localhost:8769,最后暴露自己的actuator的所有端口信息,具体配置如下:
spring:
  application:
    name: admin-client
  boot:
    admin:
      client:
        url: http://localhost:8769
server:
  port: 8768

management:
  endpoints:
    web:
      exposure:
        include: '*'
  endpoint:
    health:
      show-details: ALWAYS
在工程的启动文件如下:
@SpringBootApplication
public class AdminClientApplication {
public static void main(String[] args) {
SpringApplication.run( AdminClientApplication.class, args );
}
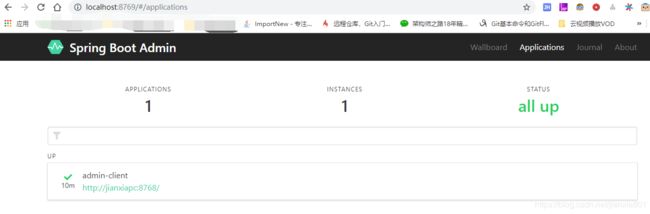
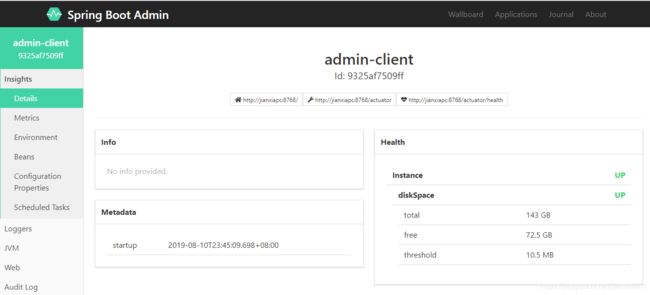
}一次启动两个工程,在浏览器上输入localhost:8769 ,浏览器显示的界面如下
示例文件源码所在位置:https://github.com/jianxia612/StudySampleJava/tree/master/springboot-admin
3、开源项目spring-boot-plus单微服务监控实践
本文仅仅只针对关于SpringBoot Admin的相关(pom.xml)配置和说明如下所示:
        UTF-8
        UTF-8
        ${parent.version}
        1.8
        2.1.6.RELEASE


	de.codecentric
	spring-boot-admin-starter-server
	${spring-boot-admin.version}


	de.codecentric
	spring-boot-admin-starter-client
	${spring-boot-admin.version}
其中yaml文件配置如下:
# 方便Spring Boot Admin页面上实时查看日志
# logback.xml中有详细的日志配置
logging:
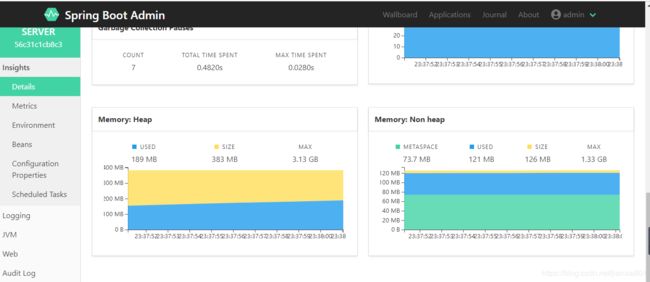
file: logs/spring-boot-plus-log.log最后运行后监控截图如下所示:

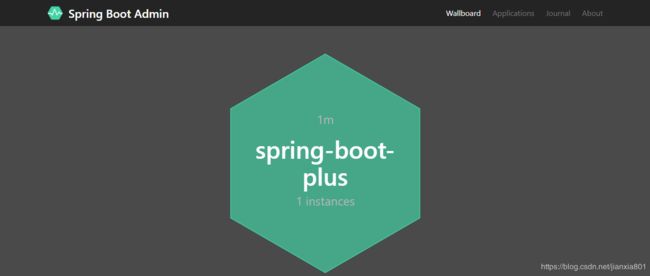
spring-boot-plus 所在开源地址:https://gitee.com/geekidea/spring-boot-plus.git
4、总结
本文主要的目的是针对如何使用SpringBoot Admin进行SpringBoot微服务后端程序的时候监控。并且通过使用SpringCloud和基本SpringBoot进行监控基本实现。同时本人也参考了其他人不少文章。同时也是作为本人一个学习终结,可以针对以后搭建监控应用作为备注。如果能够帮助学习此部分相关知识的人也是一种荣幸。
5、参考文章
Spring Boot Admin 2.1.0 全攻略 SpringBoot2.x搭建SpringBootAdmin2.x
Spring Boot Admin 监控 Spring Boot Admin-应用健康监控后台管理
SpringBoot admin 2.0 详解(特别详细)