一元线性回归和梯度下降的python代码实现
import numpy as np
import matplotlib.pyplot as plt

import matplotlib
matplotlib.rcParams['font.sans-serif'] = ['SimHei']
matplotlib.rcParams['font.family']='sans-serif'
matplotlib.rcParams['axes.unicode_minus'] = False
In [2]:
def loadDataSet(filename):
    X = []
    Y = []
    with open(filename, 'rb') as f:
        for idx, line in enumerate(f):
            line = line.decode('utf-8').strip()
            if not line:
                continue

            eles = line.split()

            if idx == 0:
                numFea = len(eles)

            eles = map(float, eles)

            X.append(eles[:-1])
            Y.append([eles[-1]])
    return np.array(X), np.array(Y)
我们的假设函数是:
hθ(x)=θXhθ(x)=θX
X:m∗nX:m∗n
θ:n∗1θ:n∗1
hθ:m∗1hθ:m∗1
In [3]:
def h(theta, X):
    return np.dot(X, theta)
我们的代价函数是:
J(θ0,θ1)=12m∑i=1m(hθ(x(i))−y(i))2J(θ0,θ1)=12m∑i=1m(hθ(x(i))−y(i))2
In [4]:
def J(theta, X, Y):
    m = len(X)
    return np.sum(np.dot((h(theta,X)-Y).T , (h(theta,X)-Y)) / (2 * m))
我们的梯度下降更新公式是:
θ0:=θ0−α1m∑i=1m(hθ(x(i))−y(i))θ0:=θ0−α1m∑i=1m(hθ(x(i))−y(i))
θ1:=θ1−α1m∑i=1m(hθ(x(i))−y(i))⋅x(i)θ1:=θ1−α1m∑i=1m(hθ(x(i))−y(i))⋅x(i)
In [5]:
def bgd(alpha, maxloop, epsion, X, Y):

    m,n = X.shape # m是样本数,n是特征数,其实也就是参数theta的个数

    theta = np.zeros((2,1)) # 参数theta全部初始化为0

    count = 0 # 记录迭代轮次
    converged = False # 是否已经收敛的标志
    error = np.inf # 当前的代价函数值
    errors = [] # 记录每一次迭代得代价函数值
    thetas = {0:[theta[0,0]],1:[theta[1,0]]} # 记录每一轮参数theta的更新


    while count<=maxloop:
        if(converged):
            break
        count = count + 1
        temp1 = theta[0, 0] - alpha / m * (h(theta, X) - Y).sum()
        temp2 = theta[1, 0] - alpha / m * (np.dot(X[:,1][:,np.newaxis].T,(h(theta,X) - Y))).sum()

        # 同步更新
        theta[0, 0] = temp1
        theta[1, 0] = temp2
        thetas[0].append(temp1)
        thetas[1].append(temp2)

        error = J(theta, X, Y)
        errors.append(error)

        if(error < epsilon):
            converged = True
    return theta,errors,thetas
梯度下降编写完成,准备好数据回归吧!
In [6]:
X, Y = loadDataSet('./data/ex1.txt')
print X.shape
print Y.shape
(97, 1)
(97, 1)
In [7]:
m, n = X.shape
X = np.concatenate((np.ones((m ,1)), X), axis=1)
In [8]:
X.shape
Out[8]:
(97, 2)
In [9]:
alpha = 0.02 # 学习率
maxloop = 1500 # 最大迭代次数
epsilon = 0.01 # 收敛判断条件

result = bgd(alpha, maxloop, epsilon, X, Y)
theta, errors, thetas = result
In [10]:
xCopy = X.copy()
xCopy.sort(0)
yHat = h(theta, xCopy) # 预测值
In [11]:
xCopy[:,1].shape,yHat.shape, theta.shape
Out[11]:
((97,), (97, 1), (2, 1))
In [12]:
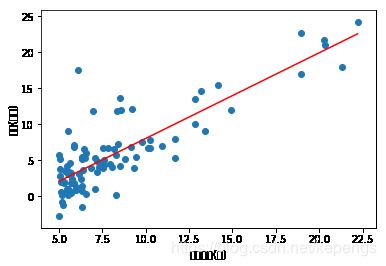
# 绘制回归直线
plt.xlabel(u'城市人口(万)')
plt.ylabel(u'利润(万元)')
plt.plot(xCopy[:,1], yHat,color='r')
plt.scatter(X[:,1].flatten(), Y.T.flatten())
plt.show()
/Users/sunkepeng/anaconda2/lib/python2.7/site-packages/matplotlib/font_manager.py:1331: UserWarning: findfont: Font family [u'sans-serif'] not found. Falling back to DejaVu Sans
  (prop.get_family(), self.defaultFamily[fontext]))
In [13]:
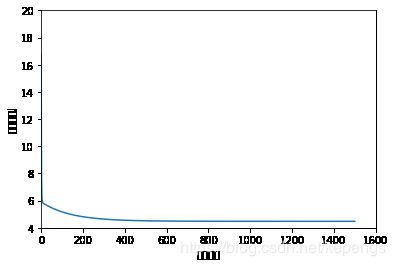
# 绘制代价曲线
plt.xlim(-1,1600)
plt.ylim(4,20)
plt.xlabel(u'迭代次数')
plt.ylabel(u'代价函数J')
plt.plot(range(len(errors)), errors)
Out[13]:
[]
In [16]:
# 准备网格数据,以备画梯度下降过程图
%matplotlib inline
from mpl_toolkits.mplot3d import axes3d
size = 100
theta0Vals = np.linspace(-10,10, size)
theta1Vals = np.linspace(-2, 4, size)
JVals = np.zeros((size, size))
for i in range(size):
    for j in range(size):
        col = np.matrix([[theta0Vals[i]], [theta1Vals[j]]])
        JVals[i,j] = J(col, X, Y)

theta0Vals, theta1Vals = np.meshgrid(theta0Vals, theta1Vals)
JVals = JVals.T
In [18]:
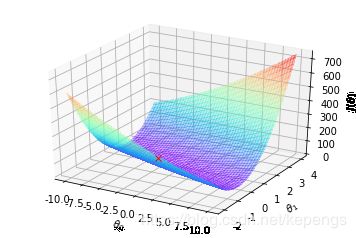
# 绘制3D代价函数图形
contourSurf = plt.figure()
ax = contourSurf.gca(projection='3d')

ax.plot_surface(theta0Vals, theta1Vals, JVals,  rstride=2, cstride=2, alpha=0.3,
                cmap=matplotlib.cm.rainbow, linewidth=0, antialiased=False)
ax.plot(theta[0], theta[1], 'rx')
ax.set_xlabel(r'$\theta_0$')
ax.set_ylabel(r'$\theta_1$')
ax.set_zlabel(r'$J(\theta)$')
Out[18]:
Text(0.5,0,'$J(\\theta)$')
In [19]:
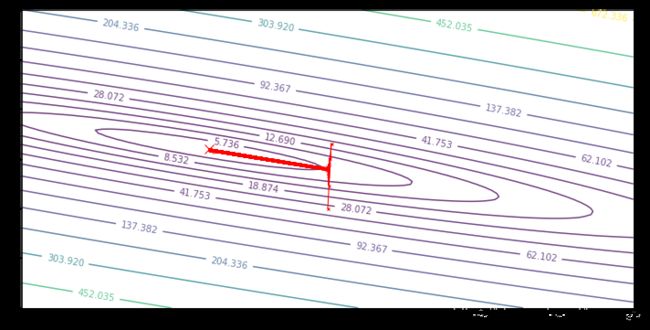
# 绘制代价函数等高线图
%matplotlib inline
plt.figure(figsize=(12,6))
CS = plt.contour(theta0Vals, theta1Vals, JVals, np.logspace(-2,3,30), alpha=.75)
plt.clabel(CS, inline=1, fontsize=10)

# 绘制最优解
plt.plot(theta[0,0], theta[1,0], 'rx', markersize=10, linewidth=3)

# 绘制梯度下降过程
plt.plot(thetas[0], thetas[1], 'rx', markersize=3, linewidth=1) # 每一次theta取值
plt.plot(thetas[0], thetas[1], 'r-',markersize=3, linewidth=1) # 用线连起来
Out[19]:
[]


