ElasticStack GetStarted
Elastic Stack结构图
1)beats/logstash 数据收集
2)elasticsearch 存储、索引搜索、聚合分析等
3)kibana 数据可视化、Elasticsearch可视化客户端

=======================================
Elasticsearch的关键配置:
logpath(通用)、datapath(一般数据存储服务有)、 ip/port(daemon服务通用)、cluster.name(集群标识)
elasticsearch在同一台机器上,启动多个实例,构建集群
- 指定端口、path.data、path.logs(指定目录不存在,会自动创建)
- 注意指定network.host绑定到非localhost地址上。默认绑定到localhost上,无法外网访问。
- elasticsearch命令不支持--help。不支持指定config文件,默认读取$ES_HOME/config/elasticsearch.yml中的配置。
elasticsearch -Ehttp.port=9201 -Epath.data=data/9201 -Epath.logs=logs/9201 -Enetwork.host=192.168.136.130
其他参考文档
=====================================================
kibana
- 作为Elasticsearch的可视化客户端工具
- 可以执行Elasticsearch相关操作,以及为数据分析提供可视化

命令行运行kibana
- 注意elasticsearch url,是url,不是host:port
- 指定服务绑定的host、port
假如要在同一台机器上,启动多个kibana进程
- 修改监听端口即可
./kibana -e http://192.168.136.130:9200 -p 8080 --host 192.168.136.130
./kibana -e http://192.168.136.130:9201 -p 8020 --host 192.168.136.130

DevTools中的console,是一个强大的Elasticsearch 脚本编辑、补全、运行等等IDE式的工具
=========================================
Beats
在线文档
轻量级的数据传送工具(类似Flume),
收集数据input ——简单处理filter——输出数据Output。。
由一组XXbeat工具构成。。各个工具,独立安装使用。
Metricbeat 操作系统的CPU、内存、磁盘等使用情况信息,以及一些常用软件(nginx等)的度量指标
Packagebeat 可用于网络抓包收集数据
Winlogbeat 用于收集windows日志

========================
在线文档
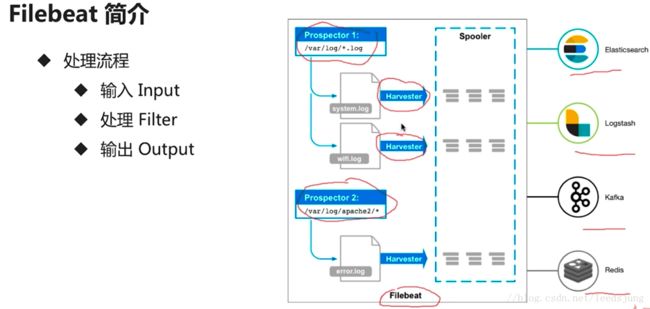
1) Filebeat 结构图:
- prospector ,监控日志文件
- 配置一个路径数组。。可以使用匹配符
- 一个prospector监控一个路径
- harvester,收割日志文件的增量,并输出
- 一个日志文件,对应一个harvester
Set up prospectors
Configure the output
https://www.elastic.co/guide/en/beats/filebeat/current/filtering-and-enhancing-data.html
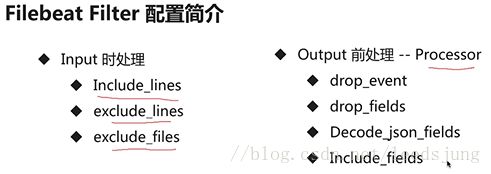
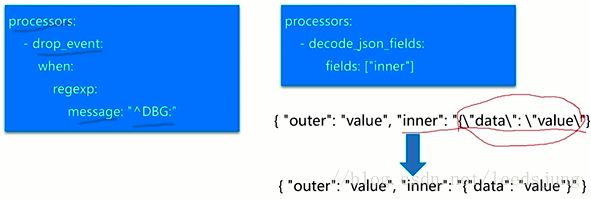
注意,正确的json格式,可能是{"outer":"value", "inner": {"data": "value"}}
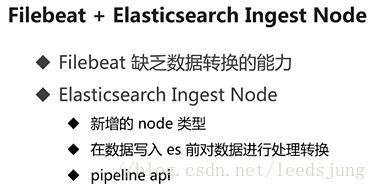
Ingest Node
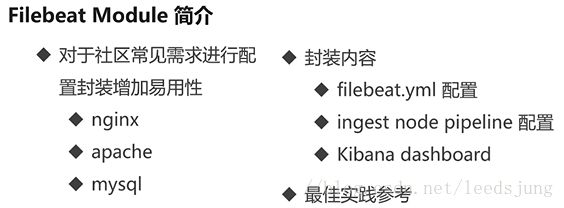
Filebeat Module
=================
demo用例
下载archive形式的filebeat安装包
配置
stdin_stdout.yml
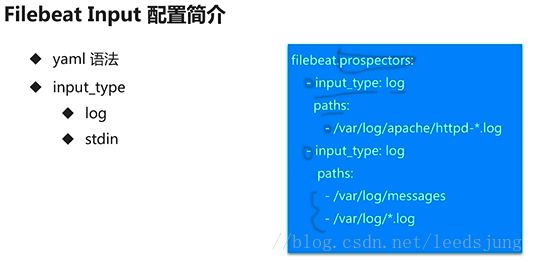
#####prospectors(input)#####
filebeat.prospectors:
# Each - is a prospector. Most options can be set at the prospector level, so
# you can use different prospectors for various configurations.
# Below are the prospector specific configurations.
- type: stdin
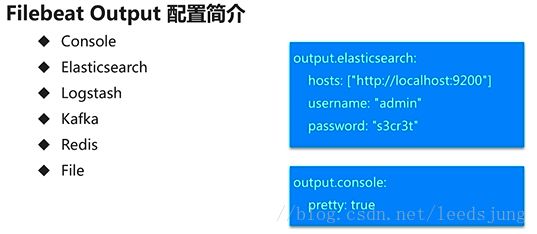
#######output#######
output.console:
pretty: true
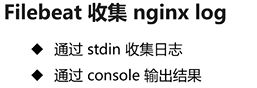
运行:tail -n 2 ~/data/nginx.log | ./filebeat -e -c stdin_stdout.yml
注意:stdin prospector表示,filebeat启动后,会从他的console界面,接收stdin作为接收到的message
===========================================================
Packetbeat

===============
demo:监听elasticsearch http 9200端口,将信息打印到console
配置packetbeat
es_stdout.yml
# 1) configure interfaces(网卡)
packetbeat.interfaces.device: ens33
# 2) configure protocols and ports
# 配置http 相关的内容,在这里
packetbeat.protocols:
- type: http
ports: [9200]
# the raw message of the request (request field) is sent to
send_request: true
#The list of
content types for which Packetbeat exports the full HTTP payload.
include_body_for: ["application/json", "x-www-form-urlencoded"]
# 3) Configure the output
output.console:
pretty: true
启动 packetbeat
sudo ./packetbeat -e -c es_stdout.yml -strict.perms=false
- 抓包需要root权限。所以加sudo
- strict.perms=false。。。不检查es.yml配置文件的权限。
=============================================================
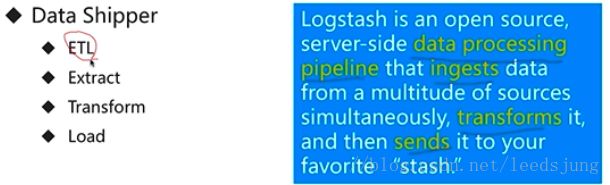
Logstash
https://www.elastic.co/guide/en/logstash/6.1/index.html
相对于beats,beats是轻量级的数据收集工具
logstash基于jvm (即java编写的应用程序)
How Logstash Works
The Logstash event processing pipeline has three stages: inputs → filters → outputs.
- 【event】作为消息载体。。。event中,包含字段fields
- processing pipeline 处理流水线,说明,任何一个event,经历input/filter(转化、修剪字段等)/output,都是一脉相承的
- 参考 Extracting Fields and Wrangling Data
也可以理解为一个ETL工具
Configuring Logstash
https://www.elastic.co/guide/en/logstash/6.1/configuration.html
Structure of a Config File
logstash 配置文件的结构和语法
https://www.elastic.co/guide/en/logstash/6.1/configuration-file-structure.html
Accessing Event Data and Fields in the Configuration
https://www.elastic.co/guide/en/logstash/6.1/event-dependent-configuration.html
logstash结构:三大插件(input、filter、Output)
https://www.elastic.co/guide/en/logstash/6.1/input-plugins.html
https://www.elastic.co/guide/en/logstash/6.1/filter-plugins.html
https://www.elastic.co/guide/en/logstash/6.1/output-plugins.html
filter(数据处理功能)比beats强大
grok,基于正则的,内置了丰富的可重用pattern,将非结构化数据转为结构化数据
mutate, 对于结构化后的数据字段,
perform general transformations on event fields. You can rename, remove, replace, and modify fields in your events.
date,将字符串类型的时间字段转为时间戳类型,方便后续处理

grok使用示例
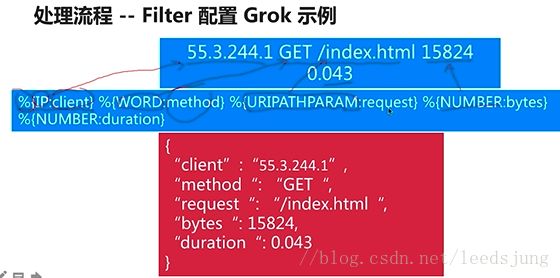
grok 内置的pattern
https://github.com/logstash-plugins/logstash-patterns-core/blob/master/patterns/grok-patterns
==============
demo用例:
将nginx日志,使用logstash收集、结构化、然后输出到console
配置文件
nginx_logstash.conf
# Input plugins
input {
stdin {
}
}
# Filter plugins
filter {
grok {
# nginx log格式:192.168.136.1 - - [09/Feb/2018:15:56:19 +0800] "GET / HTTP/1.1" 200 612 "-" "Mozilla/5.0 (Windows NT 6.1; Win64; x64) AppleWebKit/537.36 (KHTML, like Gecko) Chrome/64.0.3282.119 Safari/537.36" "-"
match => { "message" => '%{IP:client}
- - \[%{HTTPDATE:time}\] "%{WORD:method} %{DATA:uri} %{DATA:protocol}" %{NUMBER:httpStatus} %{NUMBER:length} "-" "%{DATA:agent}" "-"' }
}
# date filter,将结构化后的time字段,转为@timestamp字段,使用UTC+0时区
date {
match => [ "time", "dd/MMM/yyyy:HH:mm:ss Z" ]
locale => "en"
}
# useragent,将结构化后的agent字段,进一步结构化 user agent内部结构信息
useragent {
source => "agent"
target => "user_agent"
}
}
# output plugins
#
rubydebug 格式,更直观可读
output {
stdout { codec =>
rubydebug
}
}
启动 logstash
tail -n 2 ~/data/nginx.log | ./bin/logstash -f config/nginx_logstash.conf
============================================================
实战: 分析Elasticsearch查询语句
目标

方案

架构图

部署方案
- production cluster
- elasticsearch http://192.168.136.130:9200
- kibana http://192.168.136.130:8080
- monitoring cluster
- elasticsearch http://192.168.136.130:9201
- 用于保存抓包收集的数据。
- monitoring 和production 不能共用一个es,否则出现抓包死循环
- kibana http://192.168.136.130:8020
- 对收集的数据,进行可视化客户端聚合分析
- elasticsearch http://192.168.136.130:9201
- packetbeat 单点
- production es(9200) -----> logstash (5044)
- logstash 单点
- packetbeat(5044) -----> monitoring es(9201)
Logstash 配置
packetbeat_es.conf
# input plugin beats
input {
#
listen on port 5044 for incoming Beats connections
beats { port => 5044
}
}
# packetbeat 进来的event,已经是结构化好的json数据了。
# log进来的event,就一个message字段。
filter {
# Field References
if "search" in [request] {
grok {
match => {
# 自定义pattern
# 注意?写法,可以提取值并添加到event的field_name字段
"request" => ".*\n\{(?.*)"
}
}
grok {
match => {
"path" => "\/(?.*)\/_search"
}
}
if ![index]
{
mutate {
# 如果index 不存在,则添加字段
add_field => {
"index" => "All"
}
}
}
mutate {
update => {
# String format
# %{field}或者%{[field][sub_field]}来引用event中的fields,以printf风格生成字符串
# 因为之前为了使用regex获取query_body,得到的query_body json字符串,缺少开头的大括号。此处添加上。
"query_body" => "{%{query_body}"
}
}
}
}
# output plugins
output {
if "search" in [request] { # 注意Output到 9201 Monitoring es中
elasticsearch { hosts => "192.168.136.130:9201"}
}
}
启动logstash
./bin/logstash -f config/packetbeat_es.conf
packetbeat配置
es_logstash.yml
# 1)configure interfaces(网卡)
packetbeat.interfaces.device: any
# 2)configure protocols and ports
# 配置http 相关的内容,在这里
packetbeat.protocols:
- type: http
ports: [9200]
# the raw message of the request (request field) is sent to
send_request: true
#The list of content types for which Packetbeat exports the full HTTP payload.
include_body_for: ["application/json", "x-www-form-urlencoded"]
# 3)Configure the output
output.
logstash:
# 连接logstash
本地
监听的5044端口
hosts:
[
"127.0.0.1:5044"
]
启动packetbeat
sudo ./packetbeat -e -c es_logstash.yml -strict.perms=false
执行测试:
在Production cluster的kibana中,执行search操作。。。
在Monitoring cluster的kibana中,查看获取的数据,并进行操作分析
===============================================
kibana使用
1)添加logstash索引
Management----index patterns----logstash-*
- 注意logstash Output到es中的数据,都是以logstash-xxx(日期)的形式命名index的。
- 所以可以通过index pattern ,添加所有的logstash索引到kibana中,便于统计分析
2)添加完index pattern后,即可通过discover查看已加入的index的相关数据
对于keep-alive的http 请求,packetbeat统计请求时间,不准确。
===============
kibana数据可视化演示
使用Visualize,基于index、聚合查询,获得可视化的数据分析结果(各种统计分析图)
可以保存查询脚本。。重复使用。
==================
