import React, { Component, PropTypes } from 'react';
import {
Spin,
} from 'antd'
import process from "./poolAnalyzeProcess";
import utils from './ResPoolUtils';
import {mapJson,geoCoordMap} from "./chinaJs.js";
import echarts from "echarts";
var phyData = [
{name: "北京", value: 0},
{name: "上海", value: 0},
{name: "广州", value: 0},
{name: "深圳", value: 0},
{name: "西安", value: 0},
{name: "成都", value: 0},
]
var vmData = [
{name: "北京", value: 0},
{name: "上海", value: 0},
{name: "广州", value: 0},
{name: "深圳", value: 0},
{name: "西安", value: 0},
{name: "成都", value: 0},
]
var convertData = function (data) {
var res = [];
for (var i = 0; i < data.length; i++) {
var geoCoord = geoCoordMap[data[i].areaName];
if (utils.replaceAllSp(geoCoord)) {
res.push(geoCoord.concat(data[i].areaName).concat(data[i].num));
}
}
return res;
};
class ResMapReviewer extends Component {
constructor(props, context) {
super(props, context);
this.router = this.context.router;
this.state = {
loading: true,
loaded:false,
phyData:phyData,
vmData:vmData
}
}
componentDidMount() {
this.setState({
loaded:true
})
process.getPoolResDistributeInfos(this.state, "", this, null);
this.initMapDidMount();
}
initMapDidMount(){
let phyData = this.state.phyData;
let vmData = this.state.vmData;
echarts.registerMap('china', mapJson); // 注册地图
var mapChart = echarts.init(document.getElementById('map'));
var option = {
backgroundColor: '#404a59',
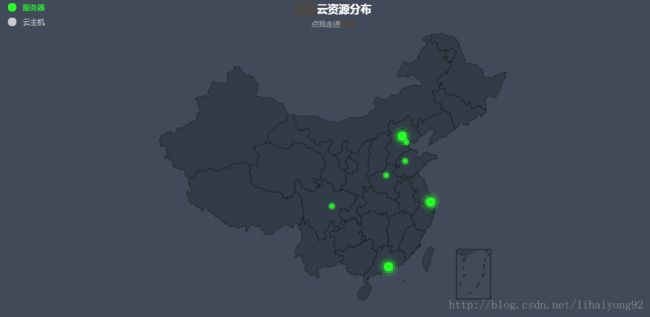
title: {
text: '云资源分布',
subtext: '点我走进百度',
sublink: 'http://www.baidu.com/',
left: 'center',
textStyle: {
color: '#fff'
}
},
tooltip : {
trigger: 'item',
formatter: function (params) { //格式化鼠标指到点上的弹窗返回的数据格式
return params.value[2] + ' : ' + params.value[3];
}
},
legend: {
orient: 'vertical',
left: 10,
selected: {
// 默认选中'系列1'
'服务器': true,
// 默认不选中'系列2'
'云主机': false
},
selectedMode:"single", //单选或多选'multiple'
data: [{
name: '服务器',
// 强制设置图形为圆。
icon: 'circle',
// 设置文本为红色
textStyle: {
color: '#28FF28'
}
},{
name: '云主机',
// 强制设置图形为圆。
icon: 'circle',
// 设置文本为红色
textStyle: {
color: 'yellow'
}
}
]
},
geo: { //地里坐标系组件(相当于每个省块)
map: 'china',
roam:true, //是否开启缩放
label: {
emphasis: { //鼠标划到后弹出的文字
color: '#FF0000', //高亮背景色
show: true, //是否高亮显示
fontSize:14 //字体大小
}
},
itemStyle: { //坐标块本身
normal: { //坐标块默认样式控制
areaColor: '#323c48',
borderColor: '#111'
},
emphasis: {
areaColor: '#79FF79'
}
}
},
series: [
{
name: '服务器', // series名称
type: 'effectScatter', // series图表类型
effectType: 'ripple', // 圆点闪烁样式,目前只支持ripple波纹式
coordinateSystem: 'geo', // series坐标系类型
data: convertData(phyData), // series数据内容
showEffectOn: 'render', //配置何时显示特效
symbolSize: function (val) { // 调整波纹大小
return utils.amendServerScale(val);
},
rippleEffect: { // ripple的样式控制
brushType: 'stroke',
color: '#28FF28',
},
label: { // 散点的数据显示控制
emphasis: {
formatter: function (params) { // 散点的数据显示控制;也可以换成'{a}','{b}','{c}'
return params.value[2];
},
position: 'right',
show: true
}
},
itemStyle: { //散点本身显示控制
normal: {
color: '#28FF28',
shadowBlur: 10,
shadowColor: '#28FF28'
}
},
zlevel: 1
},
{
name: '云主机', // series名称
type: 'effectScatter', // series图表类型
effectType: 'ripple', // 圆点闪烁样式,目前只支持ripple波纹式
coordinateSystem: 'geo', // series坐标系类型
data: convertData(this.state.vmData), // series数据内容
symbolSize: function (val) { // 调整波纹大小
return utils.amendVmScale(val);
},
showEffectOn: 'render', //配置何时显示特效
rippleEffect: { // ripple的样式控制
brushType: 'fill',
},
label: { // 散点的数据显示控制
emphasis: {
formatter: function (params) { // 散点的数据显示控制;也可以换成'{a}','{b}','{c}'
return params.value[2];
},
position: 'right',
show: true
}
},
itemStyle: { //散点本身显示控制
normal: {
color: 'yellow',
shadowBlur: 10,
}
},
zlevel: 1
}
],
symbolSize: 12,
// visualMap: {
// min: 0, // 左下角的值域最小值,必须参数
// max: 400, // 左下角的值域最大值,必须参数
// dimension: 3, // 取数据中第几个元素做为比较值,默认最后一个
// splitNumber: 5,
// color: ['#d94e5d','#eac736','#50a3ba'], //从小到大的颜色变化
// textStyle: {
// color: '#fff' // 值域控件的文本颜色
// }
// }
}
if (option && typeof option === "object") {
mapChart.setOption(option);
}
}
render() {
if(this.state.loaded){
this.initMapDidMount();
}
return (
);
}
}
export default ResMapReviewer;