python中的matplotlib(1)
调用matplotlib画图的流程:
- 调用figure()得到fig对象
- 调用fig.add_subplot(111)得到axis对象
- 调用plt.plot绘制
- plt.show()显示出figure
add_subplot()
返回一个axes对象,里面的参数abc表示在一个figure窗口中,有a行b列个小窗口,然后本次plot在第c个窗口中
from numpy import *
import matplotlib.pyplot as plt

x=arange(0,10,0.1)  # [ 0.   0.1  0.2 ...,  9.7  9.8  9.9]
print(len(x))
y=random.randn(len(x))
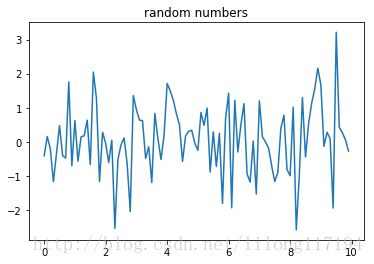
fig=plt.figure()
ax=fig.add_subplot(111)
plt.plot(x,y)
ax.set_title('random numbers')
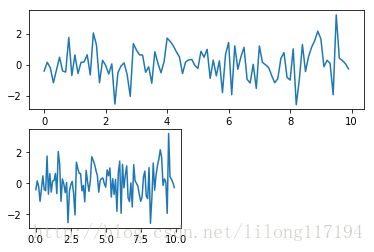
plt.show() 如果一块画布中要显示多个图:
from numpy import *
import matplotlib.pyplot as plt

fig = plt.figure()
ax = fig.add_subplot(2,1,1)
ax.plot(x,y)
ax = fig.add_subplot(2,2,3)
ax.plot(x,y)
plt.show()画散点图scatter
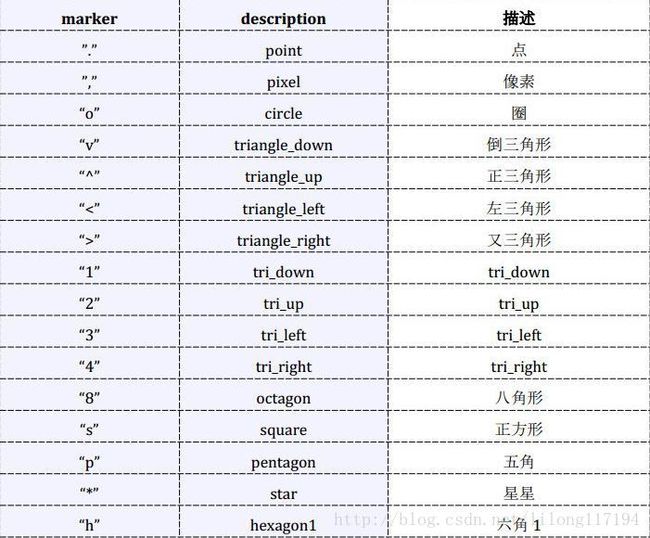
matplotlib.pyplot.scatter(x,y,s=20,c=’b’,marker=’o’,cmap=None,norm=None,vmin=None,
vmax=None,linewidths=None,verts=None,hold=None,**kwargs)
其中颜色参数c如下:
b—(blue) g–(green) k—(blace) y–(yellow)
c—(cyan) m–(magenta) r–(red) w–(white )
显示标题,坐标轴,和图标:
from numpy import *
import matplotlib.pyplot as plt

#产生测试数据
x = np.arange(1,10)
y = x
fig = plt.figure()
ax1 = fig.add_subplot(111)
#设置标题
ax1.set_title('Scatter Plot')
#设置X轴标签
plt.xlabel('X')
#设置Y轴标签
plt.ylabel('Y')
#画散点图
ax1.scatter(x,y,c = 'r',marker = 'o')
#设置图标
plt.legend('y')
#显示所画的图
plt.show() 标记不同大小:
from numpy import *
import matplotlib.pyplot as plt

#产生测试数据
x = np.arange(1,10)
y = x
fig = plt.figure()
ax1 = fig.add_subplot(111)
#设置标题
ax1.set_title('Scatter Plot')
#设置X轴标签
plt.xlabel('X')
#设置Y轴标签
plt.ylabel('Y')
# ..........................
#画散点图
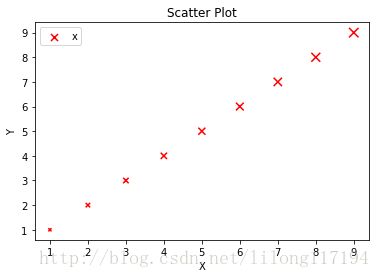
sValue = x*10
ax1.scatter(x,y,s=sValue,c='r',marker='x')
#设置图标
plt.legend('x1')
#显示所画的图
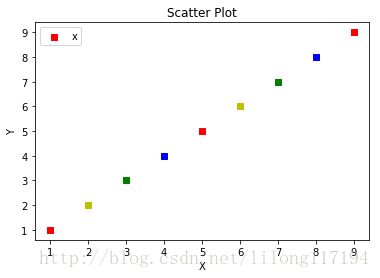
plt.show() 标记不同颜色:
from numpy import *
#import operator # 运算符模块,执行排序操作时将用到
import matplotlib.pyplot as plt

#产生测试数据
x = np.arange(1,10)
y = x
fig = plt.figure()
ax1 = fig.add_subplot(111)
#设置标题
ax1.set_title('Scatter Plot')
#设置X轴标签
plt.xlabel('X')
#设置Y轴标签
plt.ylabel('Y')
#画散点图
cValue = ['r','y','g','b','r','y','g','b','r']
ax1.scatter(x,y,c=cValue,marker='s')
#设置图标
plt.legend('x1')
#显示所画的图
plt.show()
线宽linewidths
from numpy import *
import matplotlib.pyplot as plt

#产生测试数据
x = arange(1,10)
y = x
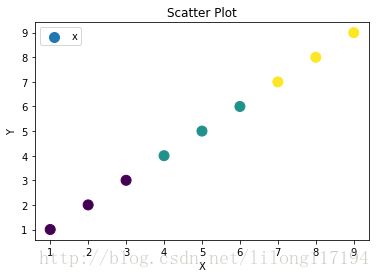
z=[1,1,1,2,2,2,3,3,3]
print(z)
fig = plt.figure()
ax1 = fig.add_subplot(111)
#设置标题
ax1.set_title('Scatter Plot')
#设置X轴标签
plt.xlabel('X')
#设置Y轴标签
plt.ylabel('Y')
#画散点图,其中c=z表示有1,2,3种颜色,s=100表示固定大小为100
ax1.scatter(x,y,c=z,s=100,marker='o')
#设置图标
plt.legend('x1')
#显示所画的图
plt.show()
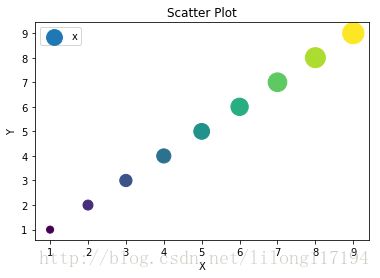
当然也可以让其图标大小和颜色随样本的属性而变化:
from numpy import *
import matplotlib.pyplot as plt

#产生测试数据
x = arange(1,10)
y = x
z=[1,1,1,2,2,2,3,3,3]
print(z)
fig = plt.figure()
ax1 = fig.add_subplot(111)
#设置标题
ax1.set_title('Scatter Plot')
#设置X轴标签
plt.xlabel('X')
#设置Y轴标签
plt.ylabel('Y')
#画散点图
#ax1.scatter(x,y,c=z,s=100,marker='o')
ax1.scatter(x,y,c=x,s=50*x,marker='o')
#设置图标
plt.legend('x1')
#显示所画的图
plt.show()
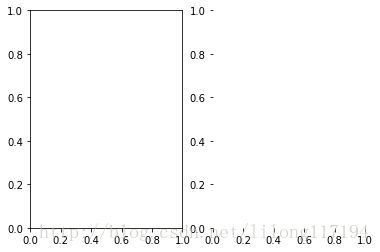
matplotlib的matplotlib.pyplot
在机器学习的决策树中要绘制树形图,会用到pyplot函数
效果如下:
>>> import matplotlib.pyplot as plt
>>> fig = plt.figure(1, facecolor='white') #创建新图形,背景为白色
>>> fig.clf()  # 清空绘图区
>>> createPlot.ax1 = plt.subplot(111, frameon=True)
>>> createPlot.ax1 = plt.subplot(111, frameon=False)import matplotlib.pyplot as plt
def createPlot():
fig = plt.figure(1, facecolor='white') #创建新图形
fig.clf() # 清空绘图区
createPlot.ax1 = plt.subplot(121, frameon=True)
createPlot.ax1 = plt.subplot(122, frameon=False)
plt.show()
createPlot() 其他的以后用到了再添加。。。。。
参考:
http://blog.csdn.net/pipisorry/article/details/40005163
http://www.cnblogs.com/bovine/archive/2012/11/09/2763374.html
http://blog.csdn.net/anneqiqi/article/details/64125186
