本篇笔记主要记录Opencv里的画图功能,主要是下面几个API:
- cv2.line() 直线
- cv2.rectangle() 矩形
- cv2.circle() 圆
- cv2.polylines() 多边形
- cv2.ellipse() 椭圆
cv2.line() 直线
cv2.line(img, pt1, pt2, color[, thickness[, lineType[, shift]]]) → img
- img,背景图
- pt1,直线起点坐标
- pt2,直线终点坐标
- color,当前绘画的颜色。如在BGR模式下,传递(255,0,0)表示蓝色画笔。灰度图下,只需要传递亮度值即可。
- thickness,画笔的粗细,线宽。若是-1表示画封闭图像,如填充的圆。默认值是1.
- lineType,线条的类型,
- 如8-connected类型、anti-aliased线条(反锯齿),默认情况下是8-connected样式ide,cv2.LINE_AA表示反锯齿线条,在曲线的时候视觉效果更佳。
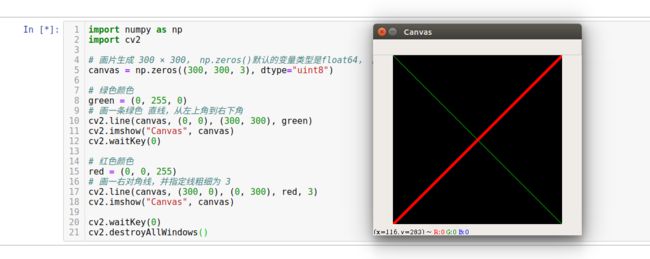
import numpy as np
import cv2

# 画片生成 300 × 300, np.zeros()默认的变量类型是float64, 所以指定dtype为 uint8
canvas = np.zeros((300, 300, 3), dtype="uint8")

# 绿色颜色
green = (0, 255, 0)
# 画一条绿色 直线,从左上角到右下角
cv2.line(canvas, (0, 0), (300, 300), green)
cv2.imshow("Canvas", canvas)
cv2.waitKey(0)

# 红色颜色
red = (0, 0, 255)
# 画一右对角线,并指定线粗细为 3
cv2.line(canvas, (300, 0), (0, 300), red, 3)
cv2.imshow("Canvas", canvas)

cv2.waitKey(0)
cv2.destroyAllWindows()
### cv2.circle() 圆
** 圆的半径,圆的颜色,圆的圆心 **
需要给出中心坐标和半径
cv2.circle(img, center, radius, color[, thickness[, lineType[, shift]]]) → img
- img,背景图
- center,圆心
- radius,半径
- color,颜色
- thickness,线粗细
from matplotlib import pyplot as plt
import numpy as np
import cv2

# 生成一画布
canvas = np.zeros((300, 300, 3), dtype = "uint8")
# 取得 圆心
(center_x, center_y) = (canvas.shape[1] // 2, canvas.shape[0] // 2)
# 圆周线颜色 白色
white = (255, 255, 255)

# 绘制多个 圆圈
for r in range(0, 175, 25):
    cv2.circle(canvas, (center_x, center_y), r, white)

plt.subplot(121)
plt.imshow(canvas)
# plt.title('circles')
# plt.show()

# 实心绘制圆圈, 此时是用 matplotlib绘制图片,red=(255,0,0)
red = (255, 0, 0)
cv2.circle(canvas, (center_x, center_y), 20, red, -1)
plt.subplot(122)
plt.imshow(canvas)

plt.show()
cv2.rectangle() 矩形
cv2.rectangle(img, pt1, pt2, color[, thickness[, lineType[, shift]]]) → img
参数与直线相同。
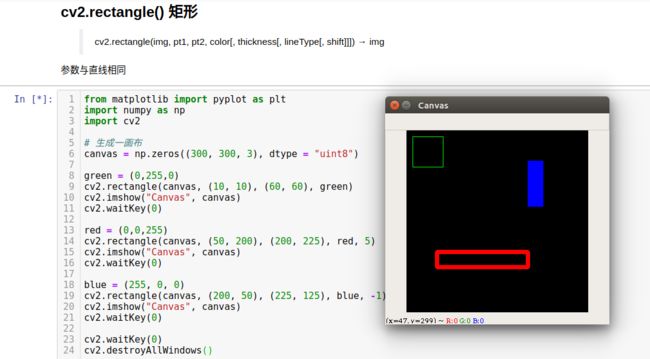
from matplotlib import pyplot as plt
import numpy as np
import cv2

# 生成一画布
canvas = np.zeros((300, 300, 3), dtype = "uint8")

green = (0,255,0)
cv2.rectangle(canvas, (10, 10), (60, 60), green)
cv2.imshow("Canvas", canvas)
cv2.waitKey(0)

red = (0,0,255)
cv2.rectangle(canvas, (50, 200), (200, 225), red, 5)
cv2.imshow("Canvas", canvas)
cv2.waitKey(0)

blue = (255, 0, 0)
cv2.rectangle(canvas, (200, 50), (225, 125), blue, -1)
cv2.imshow("Canvas", canvas)
cv2.waitKey(0)

cv2.waitKey(0)
cv2.destroyAllWindows()
绘制椭圆
cv2.ellipse(img, center, axes, angle, startAngle, endAngle, color[, thickness[, lineType[, shift]]]) → img
- img: 图片
- center:椭圆中心(x,y)
- axes:x/y轴的长度
- angle:angle--椭圆的旋转角度
- startAngle:startAngle--椭圆的起始角度
- endAngle:endAngle--椭圆的结束角度
- color: 颜色
** 角度是以顺时针方向计算的 **
from matplotlib import pyplot as plt
import numpy as np
import cv2

img = cv2.imread('image800.jpg')
# 在图中心画一个填充的半圆
cv2.ellipse(img, (256, 256), (100, 50), 0, 0, 180, (255, 0, 0), -1)
cv2.ellipse(img, (256, 100), (30, 30), 120, 0, 300, (0, 0, 255), -1, cv2.LINE_AA)
cv2.circle(img, (256, 100), 10, (255, 0, 0), -1, cv2.LINE_AA)

plt.imshow(img[:,:,::-1])
plt.show()
绘制多边形 polylines
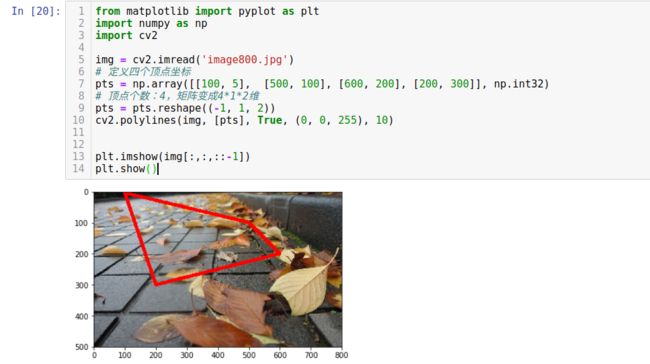
*画多边形需要指定一系列多边形的顶点坐标,相当于从第一个点到第二个点画直线,再从第二个点到第三个点画直线.... *
cv2.polylines(img, pts, isClosed, color[, thickness[, lineType[, shift]]]) → img
- isClosed: 多边形是否闭合
from matplotlib import pyplot as plt
import numpy as np
import cv2

img = cv2.imread('image800.jpg')
# 定义四个顶点坐标
pts = np.array([[100, 5],  [500, 100], [600, 200], [200, 300]], np.int32)
# 顶点个数:4,矩阵变成4*1*2维
pts = pts.reshape((-1, 1, 2))
cv2.polylines(img, [pts], True, (0, 0, 255), 10)

plt.imshow(img[:,:,::-1])
plt.show()
添加文本
cv2.putText(img, text, org, fontFace, fontScale, color[, thickness[, lineType[, bottomLeftOrigin]]]) → None
参数:
- img,图片
- text,想要输出到图像上的的文本
- org,文字的起始坐标(左下角为起点)
- position,输出位置的坐标
- Font type,字体,可以用cv2.putText()函数文档查看支持的字体,
- fontFace – Font type. One of FONT_HERSHEY_SIMPLEX, FONT_HERSHEY_PLAIN, FONT_HERSHEY_DUPLEX, FONT_HERSHEY_COMPLEX, FONT_HERSHEY_TRIPLEX, FONT_HERSHEY_COMPLEX_SMALL, FONT_HERSHEY_SCRIPT_SIMPLEX, or FONT_HERSHEY_SCRIPT_COMPLEX, where each of the font ID’s can be combined with FONT_ITALIC to get the slanted letters.
- Font Scale,指定字体大小,文字大小(缩放比例)
- 其他,如颜色,线宽,线型等,推荐使用lineType = cv2.LINE_AA
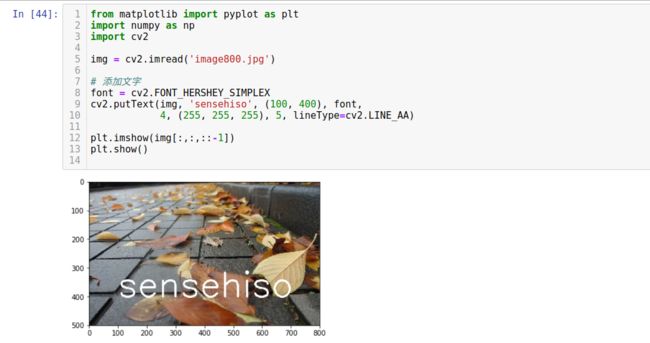
from matplotlib import pyplot as plt
import numpy as np
import cv2

img = cv2.imread('image800.jpg')

# 添加文字
font = cv2.FONT_HERSHEY_SIMPLEX
cv2.putText(img, 'sensehiso', (100, 400), font,
            4, (255, 255, 255), 5, lineType=cv2.LINE_AA)

plt.imshow(img[:,:,::-1])
plt.show()
本文主要实现opencv的画图功能及“题字”功能。


