梯度下降法 线性回归 多项式回归 python实现
-
- cost函数 J 代价函数
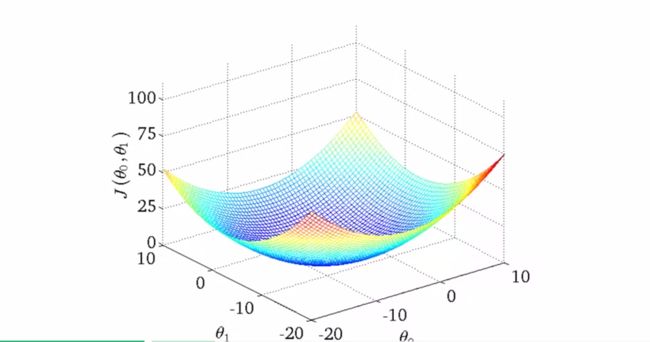
- 二维的cost函数曲线
- 多个变量时的情景
- 特征缩放
- 平均数归一化
- 梯度下降
- 多项式回归
- Python实现两个变量x0 x1
- 其他问题数组横向纵向拼接
摘自吴恩达老师课程week1-2,为其概括复习版
回归与最优化-广义线性回归
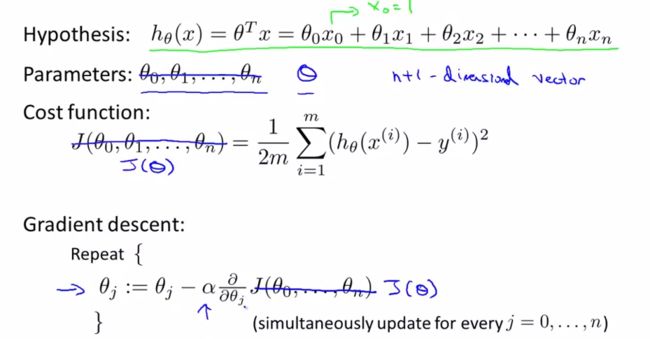
cost函数 J(θ) 代价函数
根据不同的θ取值,cost不同。最小的cost点为最佳拟合系数θ
左图为θ=0时的cost,计算后在右图中标出
二维的cost函数曲线
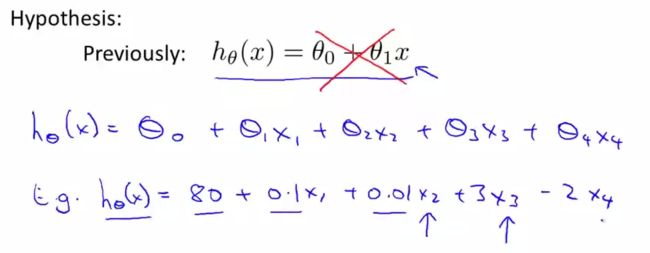
多个变量时的情景。
x1 x2表示房屋价格,楼层等
如果变量可以合并成新变量,如房屋的长(x1)和宽(x2),则可把他们合并成新变量
特征缩放
如果x1很大而x2很小
则x1改变较小的单位长度(在横轴上的距离)就可使J(θ)有较大变化
而x2的一个单位长度更大
平均数归一化
把各个变量范围分别放缩到-1,1左右
u为均值(期望), s为标准差deviation 或数据集的最大值减最小值. 可视归一化结果而定
梯度下降
首先给定θ0…θn初始值
对每个θ(j), j=0…n 求偏导数。若最终偏导数等于0则θ(j)=θ(j), 即上一次迭代和本次迭代的值相同
认为θ达到要求,为最小值
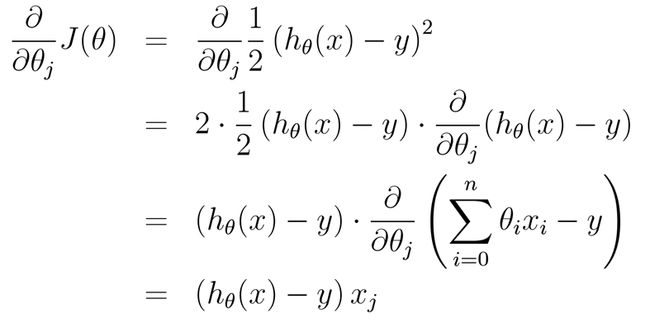
蓝线框出的即为J(θ)的导数值,便于计算。对于非线性可用diff函数或sage等计算导数(符号计算)对于是否结束迭代,可以画出J(θ)与iterator次数的关系,看J(θ)变化是否趋于稳定
多项式回归
等价于变量替换
需要注意归一化问题。数量及不同,归一更复杂
Python实现(两个变量x0 x1)
引用
# coding=utf-8
import matplotlib.pyplot as plt
from math import *
from numpy import *
import random
'''
多项式梯度下降法
http://blog.csdn.net/neuldp/article/details/52063613
'''
# x1, x2, ..xn 个变量为矩阵的横行
# 每个变量的不同取值为列

# 1对于一行的相加 2减去y 3对下一行同样操作并加和
# 参数:当前theta(向量) xset(x的矩阵mxn) yset(y的矩阵mx1)
def sum_J(theta, theta_id, xset, yset):
    sum_J_theta_id = 0
    for row in xrange(0, len(yset)):
        J = 0
        for i in xrange(0, len(theta)):
            J += theta[i] * xset[row][i]

        sum_J_theta_id += (J - yset[row]) * xset[row][theta_id]
    print sum_J_theta_id
    return sum_J_theta_id

def scaling(read_file_ndarray):
    return (read_file_ndarray - read_file_ndarray.mean())/(read_file_ndarray.max() - read_file_ndarray.min())

# degree 最大迭代次数
def grediant(xset, yset, alpha, dgree):
    theta = []
    if xset[0] is None:
        return
    # 列的数量
    num_theta = len(xset[0])
    # for i in range(0, num_theta):
    #     theta.append(0) #把所有theta初始化成0
    # 经多次试验 确定初值 使迭代步骤最少
    theta.append(0)
    theta.append(0.5)
    theta.append(0.5)

    # 行数
    length = len(yset)
    # jtheta = 0
    total = 0
    sum_total = 0
    e = 1000 # 误差 初始值可以很大
    iter_num = 0
    # while e >= 1e-2 or iter_num <= dgree:
    # for对每一个theta迭代操作
    while iter_num < dgree:
        print theta
        total = 0

        for j in range(0, num_theta):
            # 全部theta数组, theta下标, x, y, 行号
            total = sum_J(theta, j, xset, yset)
            # 更新所有theta
            theta[j] = theta[j] - (alpha/length)*(total)

        if e > (alpha/length)*(total):
            e = (alpha/length)*(total)

        iter_num += 1

    return theta


#X=[1.5,2,1.5,2,3,3,3.5,3.5,4,4,5,5]
#Y=[3,3.2,4,4.5,4,5,4.2,4.5,5,5.5,4.8,6.5]
# x0 == 1
# m x n : m组数据 n列
X = [[1, 2104, 3],
    [1, 1600, 3],
    [1, 2400, 3],
    [1, 1416, 2],
    [1, 3000, 4]
    ]

Y = [400, 330, 369, 232, 540]
# 函数入口
#a = grediant(X,Y,0.0005,10)
#print a

read_file = genfromtxt("ex1data2.txt" , delimiter=',')
print read_file.shape

X = []
for i in xrange(0,len(read_file)):

    theta1 = scaling(read_file[:, 0])
    theta0 = ones(theta1.shape)
    theta2 = scaling(read_file[:, 1])

    X = column_stack(( theta0, theta1, theta2 ))

print X
Y = scaling(read_file[:, 2])
print Y
# print read_file[:, 1].mean()
# print read_file[:, 0].mean()
# print read_file[:, 0].max()

a = grediant(X, Y, 0.1, 60)
print a
其他问题:数组横向,纵向拼接
a = np.array((0, 1))
b = np.array((2, 1))
c = np.array((-1, -1))
np.hstack((a, b, c))
# array([ 0, 1, 2, 1, -1, -1]) ## Noooooo
np.reshape(np.hstack((a, b, c)), (2, 3))
# array([[ 0, 1, 2], [ 1, -1, -1]]) ## Reshaping won't help

一种可能(但也就是

np.hstack((a[:, np.newaxis], b[:, np.newaxis], c[:, np.newaxis]))
# array([[ 0, 2, -1], [ 1, 1, -1]]) ##

有没有更好的方法?
本文地址 :CodeGo.net/550614/
-------------------------------------------------------------------------------------------------------------------------
1. numpy.column_stack 例如:

>>> a = np.array((0, 1))
>>> b = np.array((2, 1))
>>> c = np.array((-1, -1))
>>> numpy.column_stack((a,b,c))
array([[ 0, 2, -1],
  [ 1, 1, -1]])

它基本上等于

>>> numpy.vstack((a,b,c)).T


2. 我尝试了以下内容

>>> np.vstack((a,b,c))
array([[ 0, 1],
  [ 2, 1],
  [-1, -1]])
>>> np.vstack((a,b,c)).T
array([[ 0, 2, -1],
  [ 1, 1, -1]])


