python复杂网络分析库NetworkX
NetworkX是一个用Python语言开发的图论与复杂网络建模工具,内置了常用的图与复杂网络分析算法,可以方便的进行复杂网络数据分析、仿真建模等工作。networkx支持创建简单无向图、有向图和多重图(multigraph);内置许多标准的图论算法,节点可为任意数据;支持任意的边值维度,功能丰富,简单易用。
引入模块
import networkx as nx
print nx
回到顶部
无向图
例1:
#!-*- coding:utf8-*-

import networkx as nx
import matplotlib.pyplot as plt

G = nx.Graph()                 #建立一个空的无向图G
G.add_node(1)                  #添加一个节点1
G.add_edge(2,3)                #添加一条边2-3(隐含着添加了两个节点2、3)
G.add_edge(3,2)                #对于无向图,边3-2与边2-3被认为是一条边
print "nodes:", G.nodes()      #输出全部的节点: [1, 2, 3]
print "edges:", G.edges()      #输出全部的边:[(2, 3)]
print "number of edges:", G.number_of_edges()   #输出边的数量:1
nx.draw(G)
plt.savefig("wuxiangtu.png")
plt.show()
输出
|
1
2
3
|
nodes: [1, 2, 3]
edges: [(2, 3)]
number of edges: 1
|
例2:
#-*- coding:utf8-*-

import networkx as nx
import matplotlib.pyplot as plt
G = nx.DiGraph()
G.add_node(1)
G.add_node(2)                  #加点
G.add_nodes_from([3,4,5,6])    #加点集合
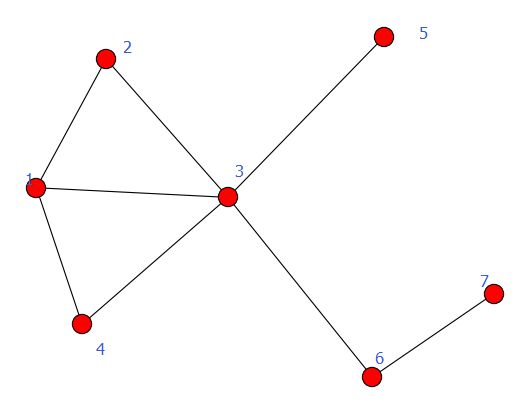
G.add_cycle([1,2,3,4])         #加环
G.add_edge(1,3)
G.add_edges_from([(3,5),(3,6),(6,7)])  #加边集合
nx.draw(G)
plt.savefig("youxiangtu.png")
plt.show()
回到顶部
有向图
例1:
#!-*- coding:utf8-*-

import networkx as nx
import matplotlib.pyplot as plt

G = nx.DiGraph()
G.add_node(1)
G.add_node(2)
G.add_nodes_from([3,4,5,6])
G.add_cycle([1,2,3,4])
G.add_edge(1,3)
G.add_edges_from([(3,5),(3,6),(6,7)])
nx.draw(G)
plt.savefig("youxiangtu.png")
plt.show()
注:有向图和无向图可以互相转换,使用函数:
- Graph.to_undirected()
- Graph.to_directed()
例2,例子中把有向图转化为无向图:
#!-*- coding:utf8-*-

import networkx as nx
import matplotlib.pyplot as plt

G = nx.DiGraph()
G.add_node(1)
G.add_node(2)
G.add_nodes_from([3,4,5,6])
G.add_cycle([1,2,3,4])
G.add_edge(1,3)
G.add_edges_from([(3,5),(3,6),(6,7)])
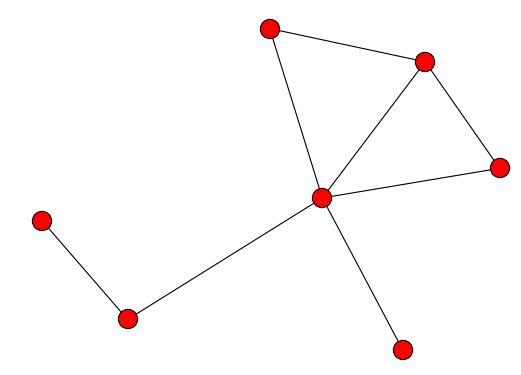
G = G.to_undirected()
nx.draw(G)
plt.savefig("wuxiangtu.png")
plt.show()
注意区分以下2例
例3-1
#-*- coding:utf8-*-

import networkx as nx
import matplotlib.pyplot as plt

G = nx.DiGraph()

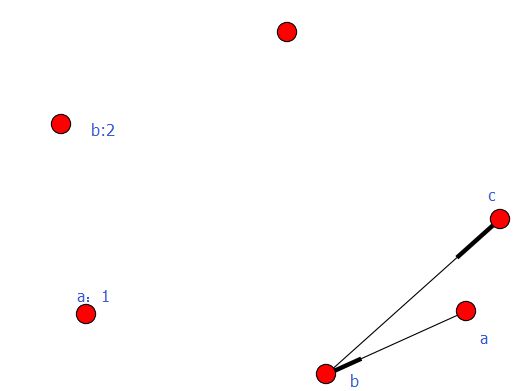
road_nodes = {'a': 1, 'b': 2, 'c': 3}
#road_nodes = {'a':{1:1}, 'b':{2:2}, 'c':{3:3}}
road_edges = [('a', 'b'), ('b', 'c')]

G.add_nodes_from(road_nodes.iteritems())
G.add_edges_from(road_edges)

nx.draw(G)
plt.savefig("youxiangtu.png")
plt.show()
例3-2
#-*- coding:utf8-*-

import networkx as nx
import matplotlib.pyplot as plt

G = nx.DiGraph()

#road_nodes = {'a': 1, 'b': 2, 'c': 3}
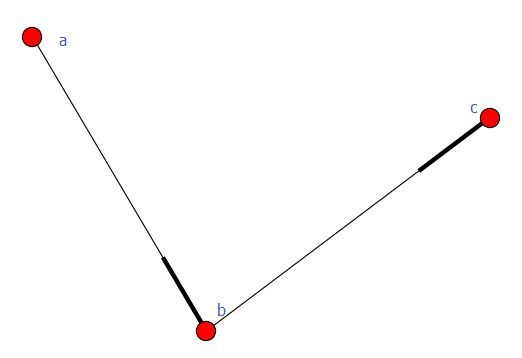
road_nodes = {'a':{1:1}, 'b':{2:2}, 'c':{3:3}}
road_edges = [('a', 'b'), ('b', 'c')]

G.add_nodes_from(road_nodes.iteritems())
G.add_edges_from(road_edges)

nx.draw(G)
plt.savefig("youxiangtu.png")
plt.show()
回到顶部
加权图
有向图和无向图都可以给边赋予权重,用到的方法是add_weighted_edges_from,它接受1个或多个三元组[u,v,w]作为参数,其中u是起点,v是终点,w是权重。
例1:
#!-*- coding:utf8-*-

import networkx as nx
import matplotlib.pyplot as plt
G = nx.Graph()                                        #建立一个空的无向图G
G.add_edge(2,3)                                     #添加一条边2-3(隐含着添加了两个节点2、3)
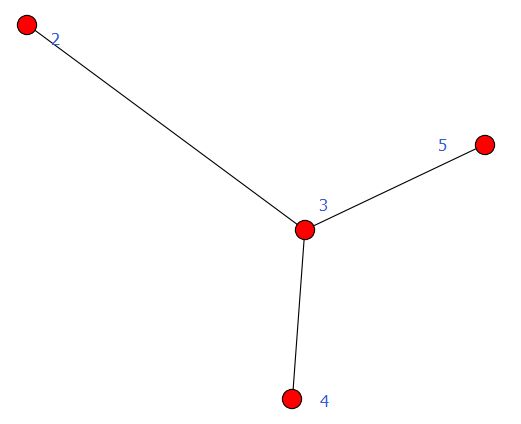
G.add_weighted_edges_from([(3, 4, 3.5),(3, 5, 7.0)])                                     #对于无向图,边3-2与边2-3被认为是一条边


print G.get_edge_data(2, 3)
print G.get_edge_data(3, 4)
print G.get_edge_data(3, 5)

nx.draw(G)
plt.savefig("wuxiangtu.png")
plt.show()
输出
{}
{'weight': 3.5}
{'weight': 7.0}
回到顶部
经典图论算法计算
计算1:求无向图的任意两点间的最短路径
# -*- coding: cp936 -*-
import networkx as nx
import matplotlib.pyplot as plt

#计算1:求无向图的任意两点间的最短路径
G = nx.Graph()
G.add_edges_from([(1,2),(1,3),(1,4),(1,5),(4,5),(4,6),(5,6)])
path = nx.all_pairs_shortest_path(G)
print path[1]
回到顶部
强连通、弱连通
- 强连通:有向图中任意两点v1、v2间存在v1到v2的路径(path)及v2到v1的路径。
- 弱联通:将有向图的所有的有向边替换为无向边,所得到的图称为原图的基图。如果一个有向图的基图是连通图,则有向图是弱连通图。
距离
例1:弱连通
#-*- coding:utf8-*-

import networkx as nx
import matplotlib.pyplot as plt
#G = nx.path_graph(4, create_using=nx.Graph())
#0 1 2 3
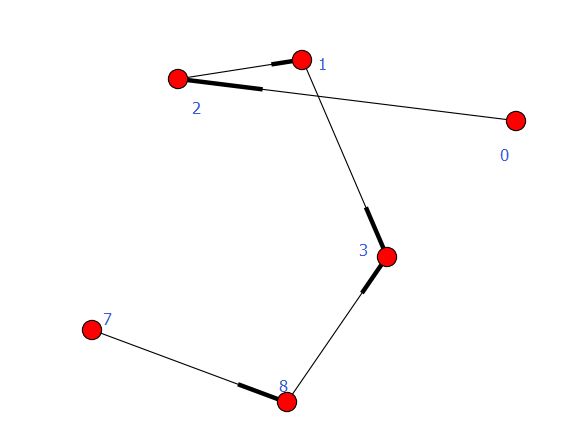
G = nx.path_graph(4, create_using=nx.DiGraph())    #默认生成节点0 1 2 3,生成有向变0->1,1->2,2->3
G.add_path([7, 8, 3])  #生成有向边:7->8->3

for c in nx.weakly_connected_components(G):
    print c

print [len(c) for c in sorted(nx.weakly_connected_components(G), key=len, reverse=True)]

nx.draw(G)
plt.savefig("youxiangtu.png")
plt.show()
执行结果
set([0, 1, 2, 3, 7, 8])
[6]
例2:强连通
#-*- coding:utf8-*-

import networkx as nx
import matplotlib.pyplot as plt
#G = nx.path_graph(4, create_using=nx.Graph())
#0 1 2 3
G = nx.path_graph(4, create_using=nx.DiGraph())
G.add_path([3, 8, 1])

#for c in nx.strongly_connected_components(G):
#    print c
#
#print [len(c) for c in sorted(nx.strongly_connected_components(G), key=len, reverse=True)]


con = nx.strongly_connected_components(G)
print con
print type(con)
print list(con)


nx.draw(G)
plt.savefig("youxiangtu.png")
plt.show()
执行结果
'generator'>
[set([8, 1, 2, 3]), set([0])]
回到顶部
子图
#-*- coding:utf8-*-

import networkx as nx
import matplotlib.pyplot as plt
G = nx.DiGraph()
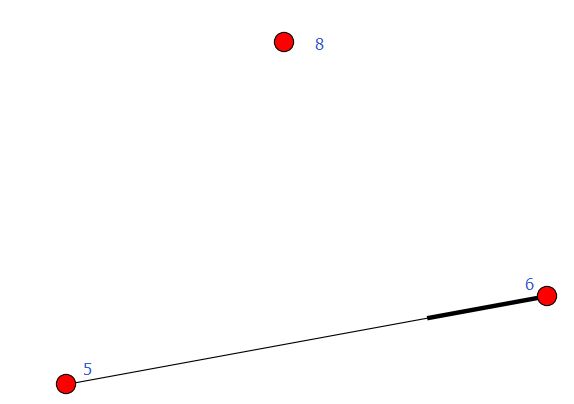
G.add_path([5, 6, 7, 8])
sub_graph = G.subgraph([5, 6, 8])
#sub_graph = G.subgraph((5, 6, 8))  #ok  一样

nx.draw(sub_graph)
plt.savefig("youxiangtu.png")
plt.show()
回到顶部
条件过滤
#原图
#-*- coding:utf8-*-

import networkx as nx
import matplotlib.pyplot as plt
G = nx.DiGraph()


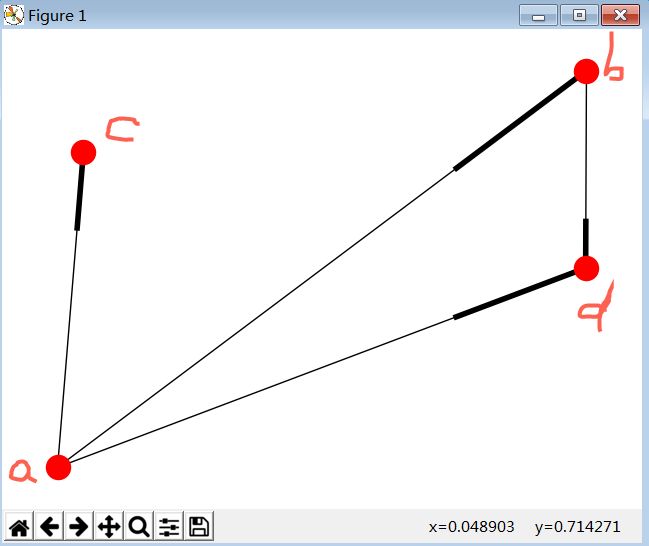
road_nodes = {'a':{'id':1}, 'b':{'id':1}, 'c':{'id':3}, 'd':{'id':4}}
road_edges = [('a', 'b'), ('a', 'c'), ('a', 'd'), ('b', 'd')]

G.add_nodes_from(road_nodes)
G.add_edges_from(road_edges)


nx.draw(G)
plt.savefig("youxiangtu.png")
plt.show()
图
#过滤函数
#-*- coding:utf8-*-

import networkx as nx
import matplotlib.pyplot as plt
G = nx.DiGraph()
def flt_func_draw():
    flt_func = lambda d: d['id'] != 1
    return flt_func

road_nodes = {'a':{'id':1}, 'b':{'id':1}, 'c':{'id':3}, 'd':{'id':4}}
road_edges = [('a', 'b'), ('a', 'c'), ('a', 'd'), ('b', 'd')]

G.add_nodes_from(road_nodes.iteritems())
G.add_edges_from(road_edges)

flt_func = flt_func_draw()
part_G = G.subgraph(n for n, d in G.nodes_iter(data=True) if flt_func(d))
nx.draw(part_G)
plt.savefig("youxiangtu.png")
plt.show()
图

