【深度学习】线性回归(一)原理及python从0开始实现
文章目录
- 线性回归
- 单个属性的情况
- 多元线性回归
- 广义线性模型
- 实验数据集
- 介绍
- 相关链接
- Python实现
- 环境
- 编码
- 最小二乘法
- 使用sklearn和pandas简化
- 梯度下降
- 方法比较
- 测试代码
- 结果
- MSE分析
- 可视化分析
- 数据归一化处理
- 零均值单位方差归一化
- 结果
- 完整源码
线性回归
线性模型(linear model)通过属性的线性组合来进行预测,形如 y = w x + b y=wx+b y=wx+b. 线性回归可以看成是单层的神经网络,包含了机器学习中模型的最基本的思想。
当定数据集 D = { ( x ⃗ 1 , y 1 ) , ( x ⃗ 2 , y 2 ) , . . . , ( x ⃗ m , y m ) } , y i ∈ R D=\{(\vec x_1,y_1),(\vec x_2,y_2),...,(\vec x_m,y_m)\},y_i∈R D={(x1,y1),(x2,y2),...,(xm,ym)},yi∈R,线性回归(linear regression)试图得到一个线性函数来预测实值输出,如下所示:
f ( x ⃗ ) = w ⃗ T x ⃗ + b f(\vec x)=\vec w^T\vec x+b f(x)=wTx+b
其中 w ⃗ = ( w 1 , w 2 , . . . w d ) , x ⃗ = ( x ⃗ 1 , x ⃗ 2 , . . . , x ⃗ m ) \vec w=(w_1,w_2,...w_d), \vec x=(\vec x_1,\vec x_2,...,\vec x_m) w=(w1,w2,...wd),x=(x1,x2,...,xm), x ⃗ \vec x x是一个矩阵, ∣ x ⃗ i ∣ = m |\vec x_i|=m ∣xi∣=m实际上就是预测对象的属性个数。 当 w ⃗ \vec w w和 b b b确定之后,线性模型就确定了。
单个属性的情况
一种最简单的场景就是需要预测的对象仅有一个属性来描述,上述数据集退化为: D = { ( x i , y i ) } i = 1 m D=\{(x_i,y_i)\}^m_{i=1} D={(xi,yi)}i=1m. 此时线性回归试图学习到一个函数: f ( x i ) = w x i + b , 使 得 f ( x i ) ≈ y i f(x_i)=wx_i+b, 使得 f(x_i)≈y_i f(xi)=wxi+b,使得f(xi)≈yi 问题的关键在于如何确定 w w w和 b b b的值!
在回归任务中,通常使用均方误差(mean squared error)来衡量 f ( x ) f(x) f(x)和 y y y的差别,即我们通常所说的损失函数。我们需要得到当 ∑ i = 1 m ( f ( x i ) − y i ) 2 \sum_{i=1}^m{(f(x_i)-y_i)^2} ∑i=1m(f(xi)−yi)2最小时, w w w和 b b b的值,我们记为: ( w ∗ , b ∗ ) = a r g w , b m i n ∑ i = 1 m ( f ( x i ) − y i ) 2 (w^*,b^*)=arg_{w,b}min\sum_{i=1}^m{(f(x_i)-y_i)^2} (w∗,b∗)=argw,bmini=1∑m(f(xi)−yi)2
很容易可以发现,均方误差在几何上对应的是欧式距离,具有非常良好的几何意义。
观察上述问题,可以很容易地联想到“利用直线拟合平面上若干点”的问题,由此,可以采用“最小二乘法(least square method)”,其试图得到一条直线使得所有的点到直线的欧式距离之和最小,这里称之为线性回归模型的最小二乘参数估计。
将 w w w和 b b b看成未知数,记 E w , b = ∑ i = 1 m ( f ( x i ) − y i ) 2 = ∑ i = 1 m ( y i − w x i − b ) 2 E_{w,b}=\sum_{i=1}^m{(f(x_i)-y_i)^2}=\sum_{i=1}^m{(y_i-wx_i-b)^2} Ew,b=∑i=1m(f(xi)−yi)2=∑i=1m(yi−wxi−b)2,解方程组:
{ ∂ E w , b ∂ w = 0 ∂ E w , b ∂ b = 0 \left \{ \begin{array}{c} \frac{\partial E_{w,b}}{\partial w}=0 \\ \\ \frac{\partial E_{w,b}}{\partial b}=0 \end{array} \right. ⎩⎨⎧∂w∂Ew,b=0∂b∂Ew,b=0
可得:
{ w = ∑ i = 1 m y i ( x i − x ‾ ) ∑ i = 1 m x i 2 − 1 m ( ∑ i = 1 m x i ) 2 b = 1 m ∑ i = 1 m y i − w x i \left \{ \begin{array}{c} w=\frac{\sum_{i=1}^m{y_i(x_i-\overline x)}}{\sum_{i=1}^m{x_i^2-\frac1m(\sum_{i=1}^m{x_i})^2}} \\ \\ b=\frac1m\sum_{i=1}^m{y_i-wx_i} \end{array} \right. ⎩⎪⎨⎪⎧w=∑i=1mxi2−m1(∑i=1mxi)2∑i=1myi(xi−x)b=m1∑i=1myi−wxi
其中 x ‾ = 1 m ∑ i = 1 m x i \overline x=\frac1m\sum_{i=1}^mx_i x=m1∑i=1mxi为 x x x的均值。
多元线性回归
在实际应用中,对象通常具有很多属性,这就引出了一个更加一般的情况,即样本由 d d d个属性描述,此时试图学到 f ( x ⃗ i ) = w ⃗ T x ⃗ i + b , 使 得 f ( x ⃗ i ) ≈ y i f(\vec x_i)=\vec w^T\vec x_i+b,使得f(\vec x_i)≈y_i f(xi)=wTxi+b,使得f(xi)≈yi
称之为多元线性回归(multivariable linear regression)。
类似的,使用最小二乘法来对 w ⃗ \vec w w和 b b b进行估计。为了矩阵运算的方便:
- 将每个样本的标记(tag)记为向量形式: y ⃗ = ( y 1 , y 2 , . . . , y m ) \vec y=(y_1,y_2,...,y_m) y=(y1,y2,...,ym)
- 利用一个向量来表示 w ⃗ \vec w w和 b b b,记为: a ⃗ = ( w ⃗ , b ) \vec a=(\vec w,b) a=(w,b),此时数据集 D D D表示为一个 m ∗ ( d + 1 ) m*(d+1) m∗(d+1)大小的矩阵 X ⃗ \vec X X, m m m表示样本大小, d d d表示属性个数。
X ⃗ = ( x 11 x 12 . . . x 1 d 1 x 21 x 22 . . . x 2 d 1 . . . . . . . . . . . . . . . x m 1 x m 2 . . . x m d 1 ) \vec X= \begin{pmatrix} x_{11} & x_{12} &...& x_{1d}&1 \\ x_{21} & x_{22} &...& x_{2d}&1 \\ ...&...&...&...&...\\ x_{m1} & x_{m2} &...& x_{md}&1 \\ \end{pmatrix} X=⎝⎜⎜⎛x11x21...xm1x12x22...xm2............x1dx2d...xmd11...1⎠⎟⎟⎞
类似于单个属性情况,此时我们需要找到 a ⃗ ∗ \vec a^* a∗满足:
a ⃗ ∗ = a r g a ⃗ m i n ( y ⃗ − X ⃗ a ⃗ ) T ( y ⃗ − X ⃗ a ⃗ ) \vec a^*=arg_{\vec a}min(\vec y-\vec X\vec a)^T(\vec y-\vec X\vec a) a∗=argamin(y−Xa)T(y−Xa)
记 E a ⃗ = ( y ⃗ − X ⃗ a ⃗ ) T ( y ⃗ − X ⃗ a ⃗ ) E_{\vec a}=(\vec y-\vec X\vec a)^T(\vec y-\vec X\vec a) Ea=(y−Xa)T(y−Xa),解方程 ∂ E a ⃗ ∂ a ⃗ = 2 X ⃗ T ( X ⃗ a ⃗ − y ⃗ ) = 0 \frac{\partial E_{\vec a}}{\partial \vec a}=2\vec X^T(\vec X\vec a-\vec y)=0 ∂a∂Ea=2XT(Xa−y)=0可得 a ⃗ \vec a a的最优解称之为最优闭式解(closed-form)。
当 X ⃗ T X ⃗ \vec X^T\vec X XTX为满秩矩阵(full-rank matrix)或者正定矩阵(positive definite matrix)时,上述方程有唯一解: a ⃗ ∗ = ( X ⃗ T X ⃗ ) − 1 X ⃗ T y ⃗ \vec a^*=(\vec X^T\vec X)^{-1}\vec X^T\vec y a∗=(XTX)−1XTy
然而现实场景中往往不满足满秩或者正定条件,此时存在多个解。最终选择哪个最为最优模型取决于算法的归纳偏好,常见的做法是引入正则化项(regularization)。
广义线性模型
比如我们需要学习到的模型为: l n y ⃗ = w ⃗ X ⃗ + b ln\vec y=\vec w\vec X+b lny=wX+b,其形式上为一个线性模型,但其实为一个“线性+对数”关系,即这里对 y ⃗ \vec y y(即tag)进行了对数变换。当然,还有其他类似变换。
记这种变换为函数: g ( x ) , g ( x ) g(x), g(x) g(x),g(x)单调可微,称: y = g − 1 ( w ⃗ T x ⃗ + b ) y=g^{-1}(\vec w^T\vec x+b) y=g−1(wTx+b)
为广义线性模型(Generalized Linear Model),其中 g ( x ) g(x) g(x)称之为联系函数(link function)。
实验数据集
介绍
采用加州大学欧文分校(UCI)公开的数据集进行实验,数据集包括9568个样本,每个样本包含5个数据:温度AT、压力V、湿度AP、压强RH、输出电力PE,前四个表示样本属性,PE表示样本的tag。换句话说,我们希望训练得到如下线性模型:
P E = w ⃗ T ( A T , V , A P , R H ) + b , 其 中 w ⃗ = ( w 1 , w 2 , w 3 , w 4 ) PE = \vec w^T (AT, V, AP, RH)+b, 其中\vec w=(w_1,w_2,w_3,w_4) PE=wT(AT,V,AP,RH)+b,其中w=(w1,w2,w3,w4)
下载的数据集包含5个sheets,每个sheets是原始数据打乱的结果,这里我们仅简单实用其中一个Sheets的数据,使用.CSV格式数据进行实验(原文是为了方便进行统计检验)。

相关链接
数据集介绍:
http://archive.ics.uci.edu/ml/datasets/Combined+Cycle+Power+Plant
数据集下载:
http://archive.ics.uci.edu/ml/machine-learning-databases/00294/
Python实现
环境
- 编码环境:Anaconda3 + PyCharm + MacOS(最好保持python版本一致,后面两个不重要)
- 使用Anaconda主要是其集成了常用的python包,很方便;当然已经安装了Python3也没关系,安装相关的包亦可
- 对于上述不满足满秩存在多个解的情况,使用梯度下降进行近似
- 梯度下降方法在机器学习模型中应用范围较广(比如神经网络),这里不再详细介绍
- 梯度下降的基本思想是通过一个学习率 α \alpha α来逐步调整 a ⃗ \vec a a参数,直到达到预定的精度或者达到预定迭代次数为止
编码
最小二乘法
这里仅使用numpy包实现,自己编写数据预处理代码、最小二乘法的矩阵实现、均方差的计算代码等。
# coding=utf-8
# author: BebDong
# date: 2018/11/27
# use only numpy to do linear regression in least square method


import numpy as np
from numpy import dot
from numpy.linalg import inv

# read files: 9568 samples, 9569 rows with first row representing the meaning of each column
data_list_matrix = np.loadtxt(open('./sheets/Sheet1.csv'), delimiter=",", skiprows=1)

# extract attributes and tags respectively
data_list_attribute = data_list_matrix[:, 0:4]
data_list_tag = data_list_matrix[:, 4:5]

# we simply split the dataset: top 75% rows as training data(7176) and the rest as testing data(2392)
X_train = data_list_attribute[:7176]
X_test = data_list_attribute[7176:]
y_train = data_list_tag[:7176]
y_test = data_list_tag[7176:]

# add a column to X_train filled with 1
X_train = np.c_[X_train, np.ones((7176, 1))]
X_test = np.c_[X_test, np.ones((2392, 1))]

# least square method: w = ((X'X)^-1)X'y
a = dot(dot(inv(dot(X_train.T, X_train)), X_train.T), y_train)

# prediction
y_prediction = dot(X_test, a)

# mean squared error(MSE) to evaluate
error = y_prediction - y_test
MSE = np.sum(pow(error, 2)) / 2392
print('MSE: ', MSE)
使用sklearn和pandas简化
使用sklearn和pandas预定义的函数进行数据集的分割、线性回归、均方差计算等,简化上述过程。sklearn包进行线性回归使用的也是最小二乘法。
# coding=utf-8
# author: BebDong
# date: 2018/11/28
# use scikit-learn and pandas to do linear regression


import pandas as pd
from sklearn.model_selection import train_test_split
from sklearn.linear_model import LinearRegression
from sklearn import metrics

# use pandas to read files
data = pd.read_csv('./sheets/Sheet1.csv')

# extract attributes and tags of samples from data
X = data[['AT', 'V', 'AP', 'RH']]
y = data[['PE']]

# split the dataset into training set and testing set
X_train, X_test, y_train, y_test = train_test_split(X, y, random_state=1)

# use scikit-learn to do linear regression
linearRegression = LinearRegression()
linearRegression.fit(X_train, y_train)

# print the parameters of the model
print('intercept: ', linearRegression.intercept_)
print('coefficient: ', linearRegression.coef_)

# testing set regression
y_prediction = linearRegression.predict(X_test)

# model evaluation by mean squared error(MSE) or root mean squared error(RMSE)
MSE = metrics.mean_squared_error(y_test, y_prediction)
print('MSE: ', MSE)
梯度下降
梯度下降的基本思想就是通过误差反过来对参数进行调整。
当 ∂ E a ⃗ ∂ a ⃗ = 2 X ⃗ T ( X ⃗ a ⃗ − y ⃗ ) = 0 \frac{\partial E_{\vec a}}{\partial \vec a}=2\vec X^T(\vec X\vec a-\vec y)=0 ∂a∂Ea=2XT(Xa−y)=0无法直接得到解时,采用梯度下降法进行近似求解,即:
a ⃗ i + 1 = a ⃗ i − α ∂ E a ⃗ ∂ a ⃗ = a ⃗ i − α X ⃗ T ( X ⃗ a ⃗ − y ⃗ ) \vec a_{i+1}=\vec a_i-\alpha\frac{\partial E_{\vec a}}{\partial \vec a}=\vec a_i-\alpha\vec X^T(\vec X\vec a-\vec y) ai+1=ai−α∂a∂Ea=ai−αXT(Xa−y)使用梯度下降法将引入两个参数:学习率 α \alpha α(或步长)和迭代次数epochs,迭代次数指使用上式进行调整的次数。
代码实现如下图所示,数据预处理和计算MSE等与最小二乘法实现一致:
# gradient descent
a_gradient = np.array([1., 1., 1., 1., 1.]).reshape(5, 1)
alpha = 0.00000000025
epochs = 100000
for i in range(epochs):
    error = dot(X_train, a_gradient) - y_train
    error_each_item = dot(X_train.T, error)
    a_gradient = a_gradient - alpha * error_each_item
需要注意的是, a l p h a alpha alpha和epochs这两个参数需要多次调整,上述参数是我调整之后比较好的结果。在这个实验中,学习率( α \alpha α)不能调得过大,因为数据没有经过归一化处理,学习率稍大就会出现不收敛的情况。
方法比较
测试代码
这里直接将上述两种方法暴力地定义为两个函数进行比较了,一种比较好的习惯是对公共代码进行单独封装,方便维护。
另外:
- 对实现的方法进行了可视化显示
- 增加了交叉验证的实验
# coding=utf-8
# author: BebDong
# date: 2018/11/28
# to packaged into functions and do evaluation on these methods


import numpy as np
from numpy import dot
from numpy.linalg import inv

import pandas as pd
from sklearn.model_selection import train_test_split, cross_val_predict
from sklearn.linear_model import LinearRegression
from sklearn import metrics

import matplotlib.pyplot as plt

import time


def visualMSE(y_test, y_prediction, title):

    # visualisation
    figure, ax = plt.subplots()
    ax.scatter(y_test, y_prediction)
    ax.plot([y_test.min(), y_test.max()], [y_test.min(), y_test.max()], 'k--', lw=4)
    ax.set_xlabel('measured')
    ax.set_ylabel('predicted')
    ax.set_title(title)
    plt.show()

    # MSE
    MSE = metrics.mean_squared_error(y_test, y_prediction)
    return MSE


def least_square():
    # read files: 9568 samples, 9569 rows with first row representing the meaning of each column
    data_list_matrix = np.loadtxt(open('./sheets/Sheet3.csv'), delimiter=",", skiprows=1)

    # extract attributes and tags respectively
    data_list_attribute = data_list_matrix[:, 0:4]
    data_list_tag = data_list_matrix[:, 4:5]

    # we simply split the dataset: top 75% rows as training data(7176) and the rest as testing data(2392)
    X_train = data_list_attribute[:7176]
    X_test = data_list_attribute[7176:]
    y_train = data_list_tag[:7176]
    y_test = data_list_tag[7176:]

    # add a column to X_train filled with 1
    X_train = np.c_[X_train, np.ones((7176, 1))]
    X_test = np.c_[X_test, np.ones((2392, 1))]

    # least square method: w = ((X'X)^-1)X'y
    a = dot(dot(inv(dot(X_train.T, X_train)), X_train.T), y_train)
    # prediction
    y_prediction = dot(X_test, a)
    MSE_least_square = visualMSE(y_test, y_prediction, 'least square without sklearn')
    print('MSE when least square: ', MSE_least_square)

    # gradient descent
    a_gradient = np.array([1., 1., 1., 1., 1.]).reshape(5, 1)
    alpha = 0.00000000025
    epochs = 100000
    for i in range(epochs):
        error = dot(X_train, a_gradient) - y_train
        error_each_item = dot(X_train.T, error)
        a_gradient = a_gradient - alpha * error_each_item
    # prediction
    y_prediction = dot(X_test, a_gradient)
    MSE_gradient = visualMSE(y_test, y_prediction, 'gradient descent')
    print('MSE when gradient descent: ', MSE_gradient)


def sklearn_way():
    # use pandas to read files
    data = pd.read_csv('./sheets/Sheet3.csv')

    # extract attributes and tags of samples from data
    X = data[['AT', 'V', 'AP', 'RH']]
    y = data[['PE']]

    # split the dataset into training set and testing set
    X_train, X_test, y_train, y_test = train_test_split(X, y, random_state=1)
    # use scikit-learn to do linear regression
    linearRegression = LinearRegression()
    linearRegression.fit(X_train, y_train)
    # testing set regression
    y_prediction = linearRegression.predict(X_test)
    # MSE
    MSE = visualMSE(y_test, y_prediction, 'least square with sklearn')
    print('MSE when sklearn: ', MSE)

    # 10 cross validation
    prediction = cross_val_predict(linearRegression, X, y, cv=10)
    MSE_cross_vali = visualMSE(y, prediction, 'MSE when cross validation')
    print('MSE when cross validation: ', MSE_cross_vali)


def main():
    # begin
    start = time.perf_counter()
    # linear regression
    least_square()
    sklearn_way()
    # end
    end = time.perf_counter()
    print("time cost: ", end - start)


if __name__ == '__main__':
    main()
结果
下面的结果仅适用于当前实验数据和当前参数配置,不具有普适性,即不代表各种方法的普遍优劣性。
MSE分析
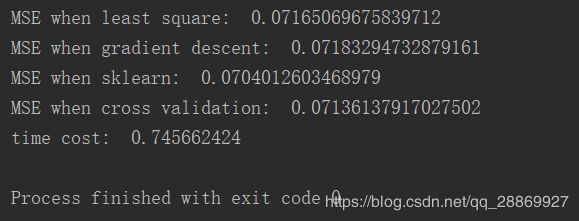
如下图所示,可以看到:
- 最小二乘法的结果优于梯度下降的方法
- 对于最小二乘法,使用sklearn包来实现相比于自己实现效果略好,因为使用sklearn包时将隐式对数据进行归一化处理
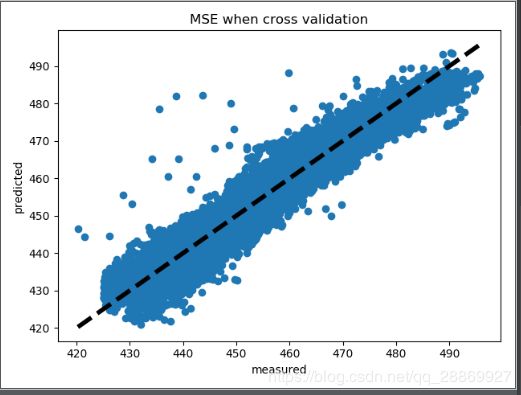
- 均使用skearn包时,交叉验证得到的结果比随机划分数据集得到的结果略差
可视化分析
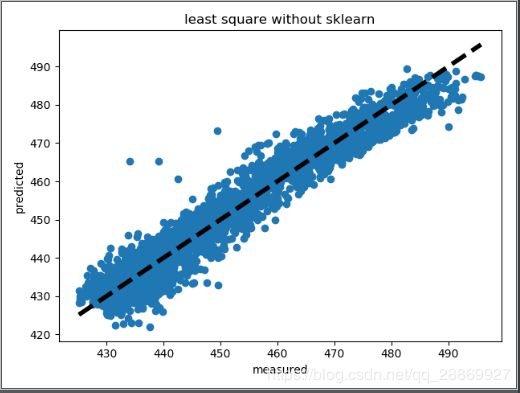
如下为模型的可视化展示,图中横坐标为测量值,纵坐标为模型的预测值。图中的点越集中分布于黑色虚线( y = x y=x y=x)周围,表面预测值和实际值越接近,模型越好,


观察可视化图形,可以发现:
- 使用最小二乘法模型相比于梯度下降模型,绘制的点更加集中于直线 y = x y=x y=x周围,表示本实验中最小二乘法的结果优于梯度下降;
- 这和利用MSE得出的实验结论是一致的。
数据归一化处理
零均值单位方差归一化
对于自己编程实现的最小二乘法和梯度下降法,使用的是numpy读取数据,这里直接使用sklearn提供的函数对数据集进行归一化处理(零均值单位方差):
from sklearn import preprocessing
# read files: 9568 samples, 9569 rows with first row representing the meaning of each column
data_list_matrix = np.loadtxt(open('./sheets/Sheet3.csv'), delimiter=",", skiprows=1)
# data normalization
data_list_matrix = preprocessing.scale(data_list_matrix)
此时,梯度下降学习率需要进行相应调整,我使用的参数如下:
alpha = 0.000002
epochs = 2500
对于使用sklearn包实现的线性回归,使用pandas读取数据,使用Z-score对数据集进行归一化处理(零均值单位方差):
# use pandas to read files
data = pd.read_csv('./sheets/Sheet3.csv')
# data normalization
data = (data - data.mean()) / data.std()
结果
MSE结果:对比归一化前后梯度下降法的参数及运行时间,可以发现对数据进行归一化以后,采用梯度下降法可以快速收敛。从MSE和可视化结果中可以看到,梯度下降的结果已经很接近利用最小二乘法直接得到的最优结果了。
有时候这种时间代价的差别可能是跨数量级的。

可视化结果:


完整源码
Github自取:
https://github.com/BebDong/LinearRegression.git
PS:对于梯度下降方法,可以对 ( α , e p o c h ) (\alpha, epoch) (α,epoch) 两个参数进行多次调整,看看能否得到更优的结果呢?
