第十章 图像分割
- 图像分割
- 点线和边缘检测
- 点检测
- 线检测
- 使用函数edge检测边缘
- Sobel检测器的通用语法
- 使用Sobel边缘检测器
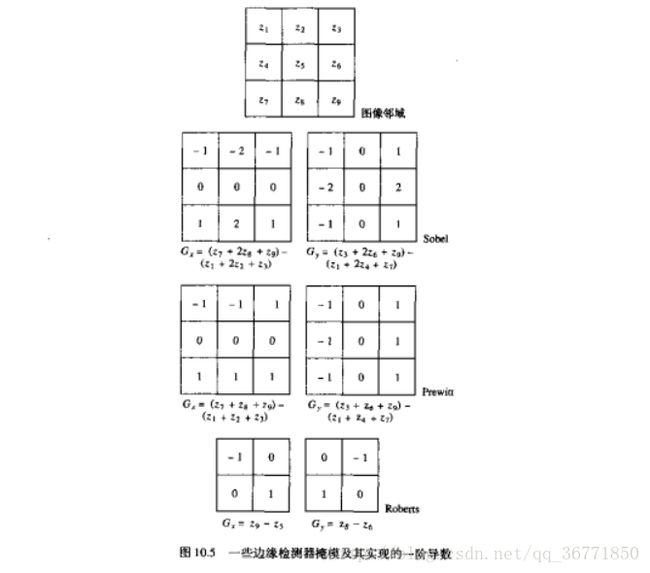
- Prewitt边缘检测器
- Roberts边缘检测器
- Log边缘检测器的基本调用语法
- 零交叉检测器的调用语法
- Canny边缘检测器是使用函数edge的最有效的边缘检测器
- SobelLoG和Canny边缘检测器的比较
- 使用霍夫变换进行线检测
- 使用Hough变换做线检测与链接
- 阈值处理
- 使用图像平滑改进全局阈值处理
- 全局和局部阈值处理的比较
- 点线和边缘检测
图像分割
图像分割就是把图像分成若干个特定的、具有独特性质的区域并提出感兴趣目标的技术和过程。它是由图像处理到图像分析的关键步骤。现有的图像分割方法主要分以下几类:基于阈值的分割方法、基于区域的分割方法、基于边缘的分割方法以及基于特定理论的分割方法等。1998年以来,研究人员不断改进原有的图像分割方法并把其它学科的一些新理论和新方法用于图像分割,提出了不少新的分割方法。图像分割后提取出的目标可以用于图像语义识别,图像搜索等等领域。
点,线和边缘检测
点检测
g = abs(imfilter(tofloat(f),w)) >= T
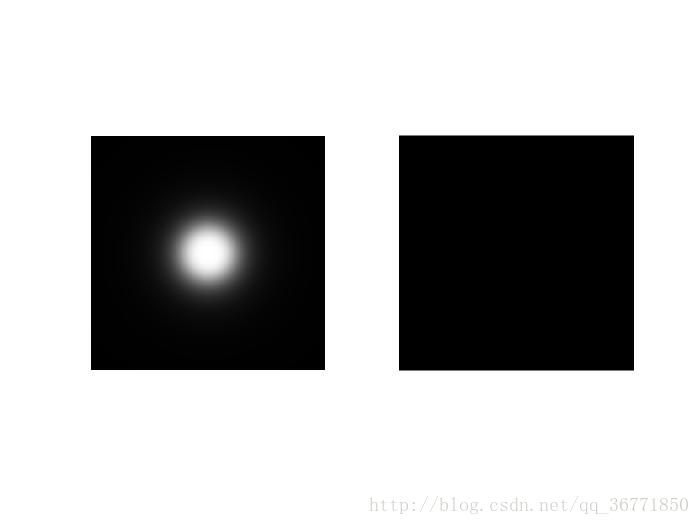
f 为输入图像,w为已检测模板,g是包含检测点的图像。
- 函数imfilter
g = abs(imfilter(double(f), w)) >= T;
w是一个合适的点检测掩模,T是一个非负阈值。
函数imfilter会将其输出转换为输入的类,且abs操作不接受整数数据,可在滤波操作中使用double(f)来防止过早的截断。
- 函数ordfilt2
在大小为m*n的所有领域中寻找一些点,这些点的最大值和最小值之差超过了T。
w = [-1 -1 -1,-1 8 -1,-1 -1 -1];
f = imread('Fig4.14(b).jpg');
g = abs(imfilter(tofloat(f),w));
T = max(g(:));
g = g >= T;
subplot(121),imshow(f);
subplot(122),imshow(g);另一种方法:
g = ordfilt2(f,m * n,ones(m,n)) - ordfilt2(f,1,ones(m,n))
g = g>=T
当 m = n = 5 时会产生上面一样的结果。
线检测
f = imread('Fig001.tif');
subplot(321),imshow(f,[]);title('连线模板图');
w = [2 -1 -1 ; -1 2 -1; -1 -1 2];
g = imfilter(double(f), w);
subplot(322),imshow(g,[]);title('45°检测器处理');
gtop = g(1:120, 1:120);
gtop = pixeldup(gtop, 4);
subplot(323),imshow(gtop,[]);title('左上方图放大');
gbot = g(end-119:end, end-119:end);
gbot = pixeldup(gbot, 4);
subplot(324),imshow(gbot,[]);title('左上方图放大右下');
g = abs(g);
subplot(325),imshow(g,[]);title('左上图的绝对值');
T = max(g(:));
g = g >= T;
subplot(326),imshow(g,[]);title('满足g>=T的所有点');

图4中的线段比图三中的线亮的多,原因是原图中右下方原件只有一个像素宽,而左上方不是,对于一个像素宽的元件,模板的响应更强。
使用函数edge检测边缘
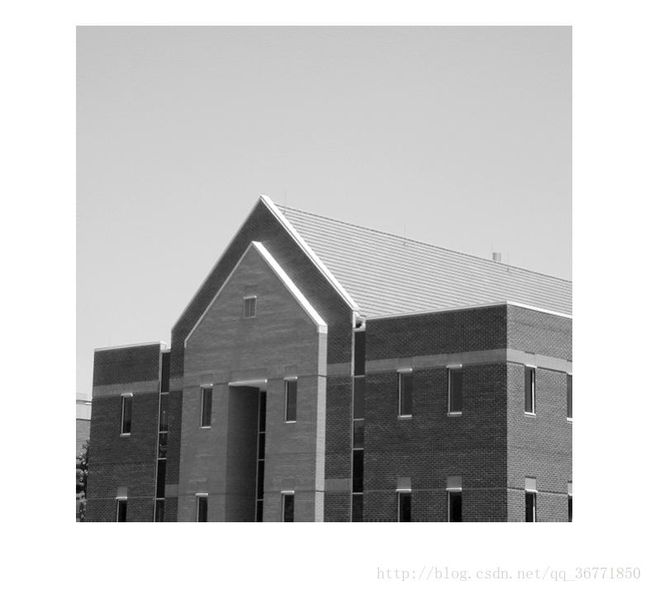
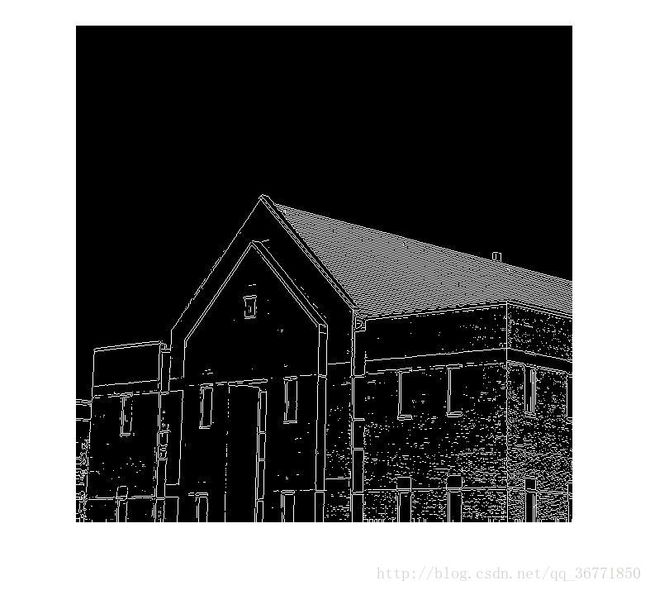
试了一下 Prewitt 的效果:
 f = imread('Fig002.tif');
g = edge(I,'prewitt',0.04);  % 0.04为梯度阈值
figure(1);
imshow(f);
figure(2);
imshow(g);Sobel检测器的通用语法
[g, t] = edge(f, ‘sobel’, T, dir)
T是一个指定的阈值,dir指定检测边缘首选方向:’horizontal’、’vertical’或’both’。
g是一幅逻辑类图像,被检测到边缘的位置处为1而在其他位置为0。输出参数t可选,是函数edge所用> 的阈值。若指定了T,则t=T。若使用语法g=edge(f)或[g,t]=edge(f),则函数edge会默认使用sobel> > 检测器。
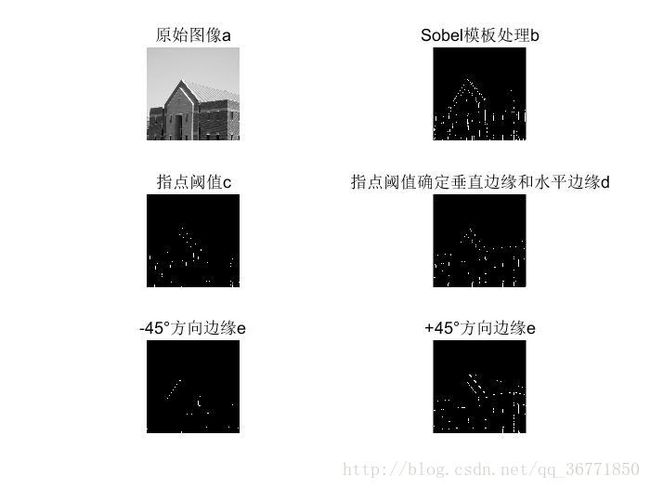
使用Sobel边缘检测器
subplot(321),imshow(f),title('原始图像a');
[gv, t] = edge(f,'sobel','vertical');
subplot(322),imshow(gv),title('Sobel模板处理b');
gv = edge(f, 'sobel', 0.15, 'vertical');
subplot(323),imshow(gv),title('指点阈值c');
gboth = edge(f, 'sobel', 0.15);
subplot(324),imshow(gboth),title('指点阈值确定垂直边缘和水平边缘d');
w45 = [-2 -1 0;-1 0 1; 0 1 2];
g45 = imfilter(double(f), w45, 'replicate');
T = 0.3 * max(abs(g45(:)));
g45 = g45 >= T;
subplot(325),imshow(g45),title('-45°方向边缘e');
f45= [0 1 2;-1 0 1;-2 -1 0];
h45= imfilter(double(f), f45,'replicate');
T = 0.3 * max(abs(h45(:)));
h45 = h45 >= T;
subplot(326),imshow(h45),title('+45°方向边缘e');
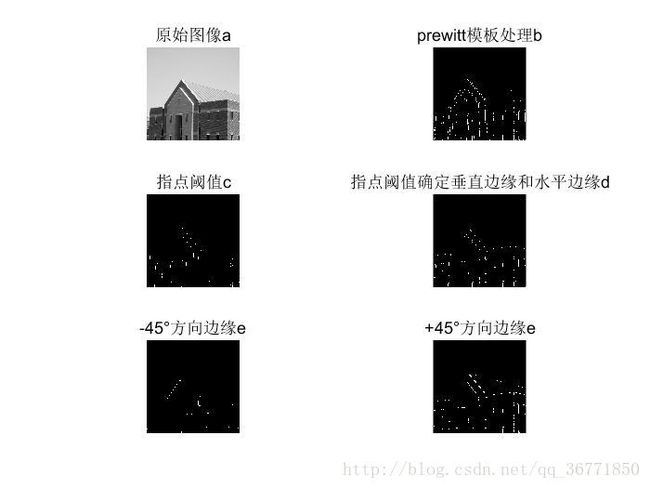
Prewitt边缘检测器
[g, t] = edge(f, ‘prewitt’,T, dir)
Prewitt 检测器比Sobel 检测器在计算上简单点,但是产生噪声可能会大一点
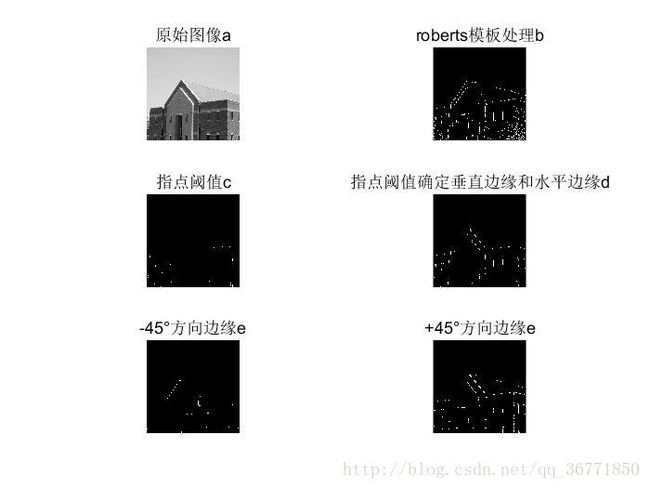
Roberts边缘检测器
[g, t] = edge(f, ‘roberts’,T, dir)
该检测器是最古老的边缘检测器之一,它也是最简单的一种边缘检测器,可是功能有限(边缘检测器是非对称的,而且不能检测诸如45°倍数的边缘),不经常使用;但经常用于硬件的实现,因为既简单又快速。
同样的调用后的图像
Log边缘检测器的基本调用语法
[g, t] = edge(f, ‘log’, T, sigma)
sigma是标准偏差,默认值为2。令T为0会产生闭合轮廓的边缘。
零交叉检测器的调用语法
[g, t] = edge(f, ‘zerocross’, T, H)
卷积是使用指定的滤波函数H执行。
Canny边缘检测器是使用函数edge的最有效的边缘检测器
[g, t] = edge(f, ‘canny’, T, sigma)
T是一个向量,T=[T1, T2],值大于T2的脊像素称为强边缘像素,T1和T2之间的脊像素称为弱边缘素。
sigma是平滑滤波器的标准偏差。默认值为1 。
Sobel,LoG和Canny边缘检测器的比较
当我们只需要建筑中的主要特征不需要太多细节时,通过改变阈值和检测边缘的首选方向来减少不必要的细节,从而可以得到一幅清晰的特征图。
[g_sobel_default, ts] = edge(f, 'sobel');
subplot(321),imshow(g_sobel_default),title('sobel');
[g_log_default, tlog] = edge(f, 'log');
subplot(323),imshow(g_log_default),title('log');
[g_canny_default, tc] = edge(f, 'canny');
subplot(325),imshow(g_canny_default),title('canny');
g_sobel_best = edge(f, 'sobel', 0.05);
subplot(322),imshow(g_sobel_best),title('gsobelbest');
g_log_best = edge(f, 'log', 0.003, 2.25);
subplot(324),imshow(g_log_best),title('glogbest');
g_canny_best = edge(f, 'canny', [0.04 0.10], 1.5);
subplot(326),imshow(g_canny_best),title('gcannybest');使用霍夫变换进行线检测
因为存在噪声,照明不均匀等因素引起的边缘断裂,以及引入杂散灰度不连续的其他效应,在执行边缘检测算法后通常会使用连接过程来把边缘像素组装成有意义的边缘。于是引入了霍夫变换这种方法。
默认语法:[H,theta,rho] = hough(f)
完整语法:[H,theta,rho] = hough(f,’ThetaRes’,val1,’RhoRes’,val2)
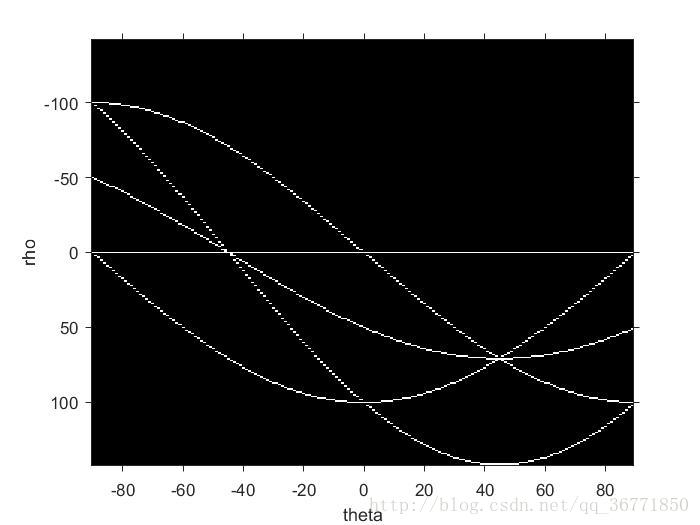
建立一幅在一些位置存在孤立前景象素的图像。
f = zeros(101,101);
f(1,1) = 1;f(101,1) = 1;f(1,101) = 1;f(101,101) = 1;f(51,51) = 1;
H = hough(f);
imshow(H,[]);
%加坐标轴
[H, theta, rho] = hough(f);
figure
imshow(H, 'XData', theta, 'YData', rho, 'InitialMagnification','fit')
axis on, axis normal
xlabel('theta'), ylabel('rho')
使用Hough变换做线检测与链接
(1)使用hough变换,将线的个数转换为交点的个数, hough
(2)找到最亮的交点,代表有最多的点在这一条线上, houghpeaks
peak = houghpeaks(H,NumPeaks)
(3)将这些点链接, houghlines
lines = houghlines(f,theta,rho,peaks)
或 lines = houghlines(…,’FillGap’,val1,’MinLength’,val2)
f = imread('Fig002.tif');
f = tofloat(f);
f = edge(f, 'canny', [0.04 0.10], 1.5);
[H,theta,rho]=hough(f,'ThetaResolution',0.2);
imshow(H,[],'XData',theta,'YData',rho,'InitiaLMagnification','fit'),
axis on,axis normal
xlabel('\theta'),ylabel('\rho')
接下来,使用函数houghpeaks找到5个看起来很明显的Hough变换峰值。
peaks = houghpeaks(H,5);
hold on
plot(theta(peaks(:,2)),rho(peaks(:,1)),'linestyle','none','marker','s','color','w')
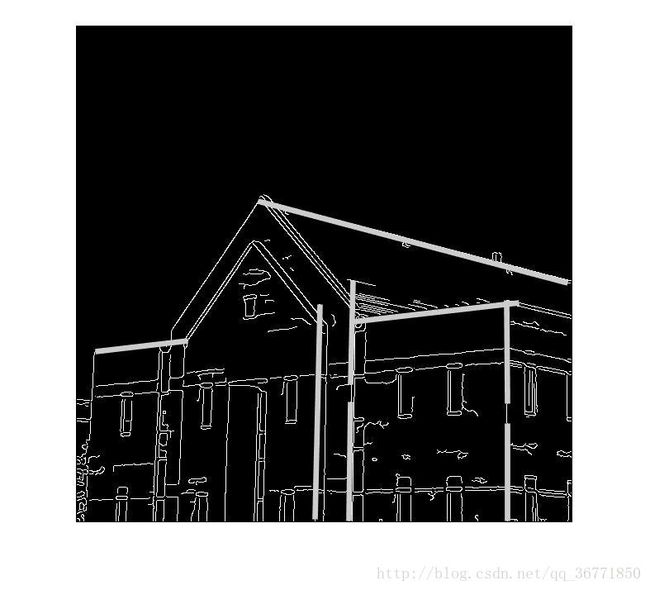
最后使用函数houghlines来查找并链接线段,并使用函数imshow,hold on和plot在原始的二值图像中叠加这些线段。 代码如下:
lines = houghlines(f,theta,rho,peaks);
figure,imshow(f),hold on
for k = 1:length(lines)
xy = [lines(k).point1;lines(k).point2];
plot(xy(:,1),xy(:,2),'LineWidth',4,'Color',[.8 .8 .8]);
end
f = imread('Fig002.tif');%读取图像
g = edge(f,'canny');%提取边
%霍夫变换
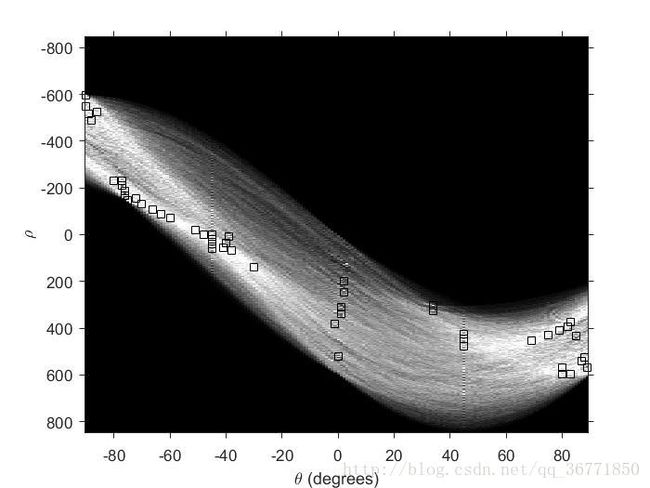
[H,theta,rho] = hough(g); % 计算二值图像的标准霍夫变换,H为霍夫变换矩阵,theta,rho为计算霍夫变换的角度和半径值
figure, imshow(imadjust(mat2gray(H)),[],'XData',theta,'YData',rho,...
'InitialMagnification','fit');
xlabel('\theta (degrees)'), ylabel('\rho');
axis on, axis normal, hold on;
colormap(hot)
% 显示霍夫变换矩阵中的极值点
P = houghpeaks(H,50,'threshold',ceil(0.3*max(H(:)))); % 从霍夫变换矩阵H中提取5个极值点
x = theta(P(:,2));
y = rho(P(:,1));
plot(x,y,'s','color','black');
% 找原图中的线
lines = houghlines(g,theta,rho,P,'FillGap',18,'MinLength',180);
figure, imshow(g), hold on
max_len = 0;
for k = 1:length(lines)
% 绘制各条线
xy = [lines(k).point1; lines(k).point2];
plot(xy(:,1),xy(:,2),'LineWidth',2,'Color','green');
% 绘制线的起点(黄色)、终点(红色)
plot(xy(1,1),xy(1,2),'x','LineWidth',2,'Color','yellow');
plot(xy(2,1),xy(2,2),'x','LineWidth',2,'Color','red');
% 计算线的长度,找最长线段
len = norm(lines(k).point1 - lines(k).point2);
if ( len > max_len)
max_len = len;
xy_long = xy;
end
end
% 以红色线高亮显示最长的线
plot(xy_long(:,1),xy_long(:,2),'LineWidth',2,'Color','red');阈值处理
计算全局阈值
f = imread('Fig004.tif');
T = 0.5*(double(min(f(:))) + double(max(f(:))));
done = false;
while~done
  g = f >= T;
  Tnext = 0.5*(mean(f(g))+mean(f(~g)));
  done = abs(T - Tnext) < 0.5;
  T = Tnext;
  end
T2 = graythresh(f);
T2 * 255
bw = im2bw(f, T2);
使用图像平滑改进全局阈值处理
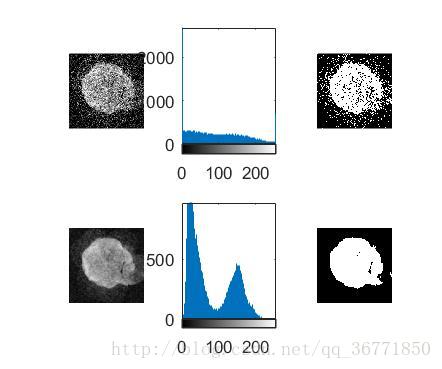
噪声会把简单的阈值处理问题变为不能解决的问题,当不能在源头降低噪声且阈值处理是选择的分割方法时,增强性能的一种常用技术是在阈值处理前先对图像进行平滑。
f = imread('Fig005.tif');
fn = imnoise(f,'gaussian',0,0.038);
subplot(231),imshow(fn);
subplot(232),imhist(fn);
Tn = graythresh(fn);
gn = im2bw(fn,Tn);
subplot(233),imshow(gn);
w = fspecial('average',5);
fa = imfilter(fn,w,'replicate');
subplot(234),imshow(fa);
subplot(235),imhist(fa);
Ta = graythresh(fa);
ga = im2bw(fa,Ta);
subplot(236),imshow(ga);
全局和局部阈值处理的比较
我们想从背景中分割出细胞,并从细胞中分割出细胞核。然而,使用单个阈值来进行分割非常不可靠。使用属性分割相当有效,当背景接近于常数且所有物体的灰度高于或低于背景灰度时,选择全局均值一般会给出好的效果。
f = imread('Fig007.tif');
[TGlobal] = graythresh(f);
gGlobal = im2bw(f,TGlobal);
subplot(221),imshow(f);
subplot(222),imshow(gGlobal);
g = localthresh(f,ones(3),30,1.5,'global');
SIG = stdfilt(f,ones(3));
subplot(223),imshow(SIG,[]);
subplot(224),imshow(g);