About how to get taget data by using pipeline
Source code
- Define a pipeline to do similar query with GRPUP BY in SQL
# 统计一天内交易成功的商品区域分布饼图
def get_closed_item_chart():
    pipeline = [
        {'$match': {'saletime': ''}},
        {'$group': {'_id': {'$slice': ['$address', 1, 1]}, 'counts': {'$sum': 1}}}
    ]
    salesum = sum([i['counts'] for i in tinfo.aggregate(pipeline)])
    #print(salesum)
    for i in tinfo.aggregate(pipeline):

        item = {
                'name': i['_id'][0] +''+ str(int(float(i['counts']/salesum) * 10000) / 100)+'%',
                'y': int(float(i['counts']/salesum) * 10000) / 100,
                'type': 'pie'
            }
        yield item
        #print(item)
#get_closed_item_chart()
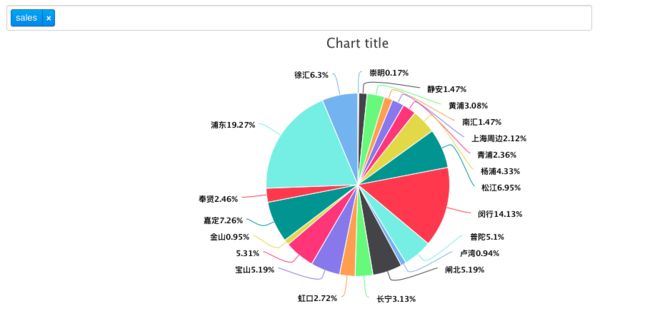
- The data format to draw a pie chart is a little different from line chart and column chart.
data = [i for i in get_closed_item_chart()]
print(data)
cdata = [{
        "type": "pie",
        'name': 'sales',
        'colorByPoint': True,
        'data': data
    }]
charts.plot(cdata, show='inline')
- The printed data is as below
[{'y': 0.17, 'type': 'pie', 'name': '崇明0.17%'}, {'y': 1.47, 'type': 'pie', 'name': '静安1.47%'}, {'y': 3.08, 'type': 'pie', 'name': '黄浦3.08%'}, {'y': 1.47, 'type': 'pie', 'name': '南汇1.47%'}, {'y': 2.12, 'type': 'pie', 'name': '上海周边2.12%'}, {'y': 2.36, 'type': 'pie', 'name': '青浦2.36%'}, {'y': 4.33, 'type': 'pie', 'name': '杨浦4.33%'}, {'y': 6.95, 'type': 'pie', 'name': '松江6.95%'}, {'y': 14.13, 'type': 'pie', 'name': '闵行14.13%'}, {'y': 5.1, 'type': 'pie', 'name': '普陀5.1%'}, {'y': 0.94, 'type': 'pie', 'name': '卢湾0.94%'}, {'y': 5.19, 'type': 'pie', 'name': '闸北5.19%'}, {'y': 3.13, 'type': 'pie', 'name': '长宁3.13%'}, {'y': 2.72, 'type': 'pie', 'name': '虹口2.72%'}, {'y': 5.19, 'type': 'pie', 'name': '宝山5.19%'}, {'y': 5.31, 'type': 'pie', 'name': '5.31%'}, {'y': 0.95, 'type': 'pie', 'name': '金山0.95%'}, {'y': 7.26, 'type': 'pie', 'name': '嘉定7.26%'}, {'y': 2.46, 'type': 'pie', 'name': '奉贤2.46%'}, {'y': 19.27, 'type': 'pie', 'name': '浦东19.27%'}, {'y': 6.3, 'type': 'pie', 'name': '徐汇6.3%'}]
The pie chart
Reference
highcharts
