随着业务系统越来越多,系统化的监控需求就来了。前天看了一下graphite,感觉整体架构还是不错的。废话不多讲,如下图:
这里简单总结一下各个组件的作用:
carbon:
负责后端数据采集,可以通过以下客户端来采集数据
客户端应用有多个方式来发布度量值:
使用一个纯文本协议工具比如 netcat (nc) 命令
使用 pickle 协议
使用高级消息队列协议(AMQP)
使用 lib 包比如 Dropwizard metrics library(http://metrics.dropwizard.io/3.2.2/getting-started.html)
whisper:
结构化的文件存储,主要用来存储时间序列数据的数据库包,它被应用通过使用 create, update, 和 fetch 操作来检索以及操作
graphite-web:
官方的图表展示(比较丑陋)
下面,我们来介绍一下安装
因为graphite是用python来实现的,所以要验证一下python 版本:python -v
我的是2.7.12,切记,一定要安装2.7系例的版本,我的服务器环境是Ubuntu 5.4.0-6ubuntu1~16.04.4.官方的文档地址是:http://graphite.readthedocs.io/en/latest/overview.html
,请大家一定耐着头皮看一下,英文不好,查词典也要弄懂。我是使用pip的方式安装的,下面是过程
1 pip安装(安装工具)
下载https://bootstrap.pypa.io/get-pip.py,执行python get-pip.py
2 pip安装好了,就可以进入正题,分别安装三个组件
export PYTHONPATH="/opt/graphite/lib/:/opt/graphite/webapp/"
pip install --no-binary=:all: https://github.com/graphite-project/whisper/tarball/master
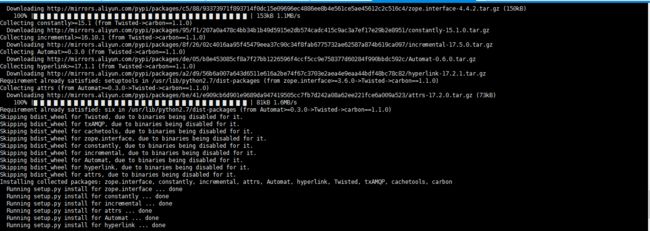
pip install --no-binary=:all: https://github.com/graphite-project/carbon/tarball/master
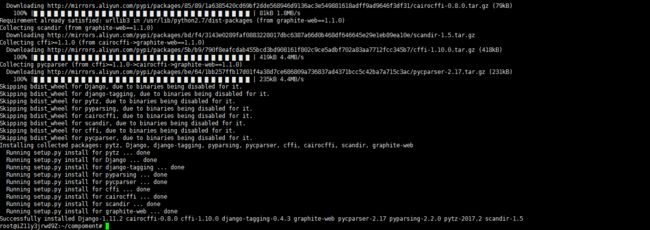
pip install --no-binary=:all: https://github.com/graphite-project/graphite-web/tarball/master
安装过程提示libffi未安装,然后手动下载安装
wget ftp://sourceware.org/pub/libffi/libffi-3.2.1.tar.gz
下载之后解压libffi之后,
./configure或者./config
make
make install(有可能还会报错,可以试着执行下面的命令)
sudo apt-get install libffi-dev
提示安装成功!(以上安装基本是傻瓜式,重点是配置)
3 数据库初始化
PYTHONPATH=/opt/graphite/webapp django-admin.py migrate --settings=graphite.settings
另外,当graphite-web安装好,可以使用graphite-manage createsuperuser来创建超级用户
4 配置文件初始化:
因为是三个组件,分别说明一下
carbon的配置文件是在/user/local/conf下面
root@iZbp10upl89i15wfkj8luzZ:/usr/local/conf# cp aggregation-rules.conf.example aggregation-rules.conf
root@iZbp10upl89i15wfkj8luzZ:/usr/local/conf# cp blacklist.conf.example blacklist.conf
root@iZbp10upl89i15wfkj8luzZ:/usr/local/conf# cp carbon.amqp.conf.example carbon.amqp.conf
root@iZbp10upl89i15wfkj8luzZ:/usr/local/conf# cp carbon.conf.example carbon.conf
root@iZbp10upl89i15wfkj8luzZ:/usr/local/conf# cp relay-rules.conf.example relay-rules.conf
root@iZbp10upl89i15wfkj8luzZ:/usr/local/conf# cp rewrite-rules.conf.example rewrite-rules.conf
root@iZbp10upl89i15wfkj8luzZ:/usr/local/conf# cp storage-aggregation.conf.example storage-aggregation.conf
root@iZbp10upl89i15wfkj8luzZ:/usr/local/conf# cp storage-schemas.conf.example storage-schemas.conf
root@iZbp10upl89i15wfkj8luzZ:/usr/local/conf# cp whitelist.conf.example whitelist.conf
graphite-web的配置:
daashboard.conf:这个主是展示页面的UI配置,基本不用改。
local_settings.py:修改时区,whisper的数据存储地址(这个地方的坑比较深,默认情况下,不指定,是读的/opt/graphite/storage/下面的),实际上carbon启动之后,数据是在
不然,你的carbon把数据采集到了,但在graphite-web那边就一直不显示。
5 服务启动
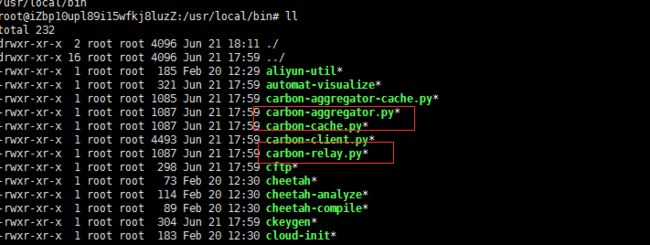
carbon:主要是三个python后台进程的启动,官方说明:http://graphite.readthedocs.io/en/latest/carbon-daemons.html
graphite-web:图标展示只需要启 动两个
最后一个脚本启动命令:
PYTHONPATH=`pwd`/storage/whisper ./bin/run-graphite-devel-server.py --port=8085 --libs=`pwd`/webapp /opt/graphite 1>/opt/graphite/storage/log/webapp/process.log 2>&1 &
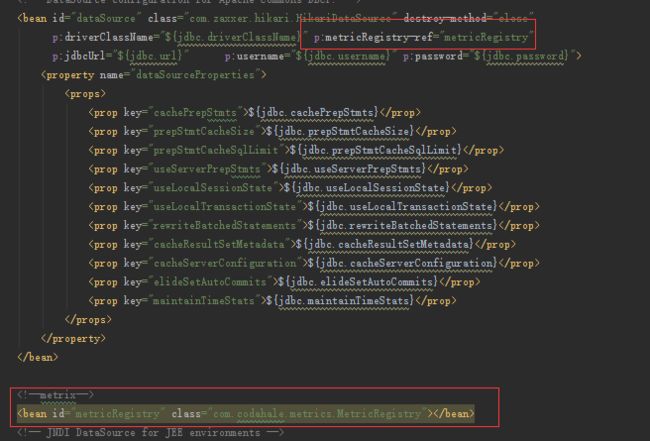
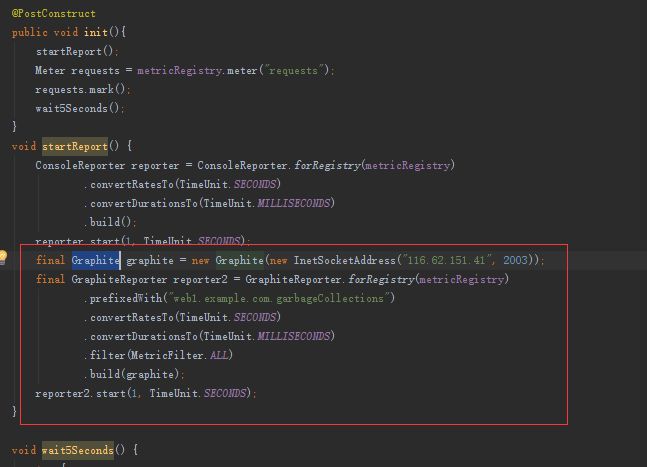
6 客户端数据采集:使用dropwizard metric来构建指标数据,我这里主要是数据库相关参数
采集源接入:
数据上报方式:
7 效果如图:
接下来,考虑使用grafana来做展现。
参考地址:https://www.digitalocean.com/community/tutorials/how-to-install-and-use-graphite-on-an-ubuntu-14-04-server
http://graphite.readthedocs.io/en/latest/overview.html
http://www.infoq.com/cn/articles/graphite-intro


